Technical Analysis of ITDI 2024-05-10
Overview:
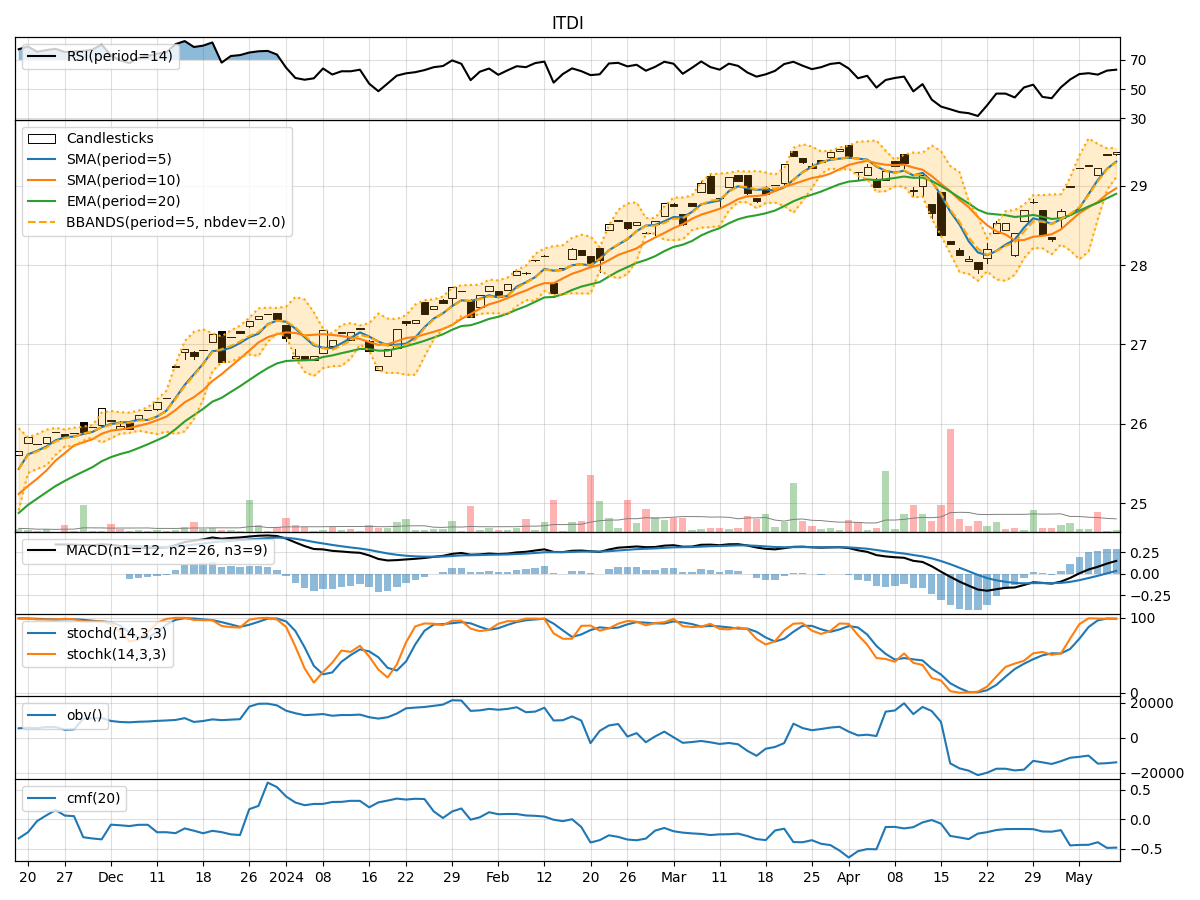
In analyzing the technical indicators for ITDI over the last 5 days, we will delve into the trend, momentum, volatility, and volume indicators to provide a comprehensive outlook on the possible stock price movement in the coming days. By examining key metrics such as moving averages, MACD, RSI, Bollinger Bands, and OBV, we aim to offer valuable insights and recommendations for potential investors.
Trend Indicators:
- Moving Averages (MA): The 5-day moving average has been consistently above the closing prices, indicating a bullish trend.
- MACD: The MACD line has been above the signal line, suggesting a positive momentum in the stock price.
- EMA: The exponential moving average has been trending upwards, supporting the bullish sentiment.
Momentum Indicators:
- RSI: The Relative Strength Index has been in the neutral to slightly overbought territory, indicating a balanced momentum.
- Stochastic Oscillator: Both %K and %D have been in the overbought zone, signaling a potential reversal or consolidation.
- Williams %R: The Williams %R is hovering around the oversold region, suggesting a possible buying opportunity.
Volatility Indicators:
- Bollinger Bands: The stock price has been trading within the bands, indicating a period of consolidation.
- Bollinger %B: The %B indicator shows the stock price is within the bands, suggesting a neutral stance.
Volume Indicators:
- On-Balance Volume (OBV): The OBV has been fluctuating, indicating indecision among investors.
- Chaikin Money Flow (CMF): The CMF has been negative, reflecting selling pressure in the stock.
Key Observations:
- The trend indicators suggest a bullish sentiment with moving averages and MACD supporting upward momentum.
- Momentum indicators show a mixed signal with RSI in a neutral zone, Stochastic in overbought territory, and Williams %R indicating a potential reversal.
- Volatility indicators point towards a period of consolidation as the stock price remains within the Bollinger Bands.
- Volume indicators reflect indecision among investors with OBV fluctuating and CMF showing selling pressure.
Conclusion:
Based on the analysis of the technical indicators, the stock of ITDI is likely to experience sideways movement or consolidation in the coming days. While the trend indicators support a bullish view, the mixed signals from momentum indicators and the consolidation pattern indicated by volatility indicators suggest a lack of clear direction. Investors should closely monitor key levels such as support and resistance to make informed trading decisions.