Technical Analysis of ITM 2024-05-10
Overview:
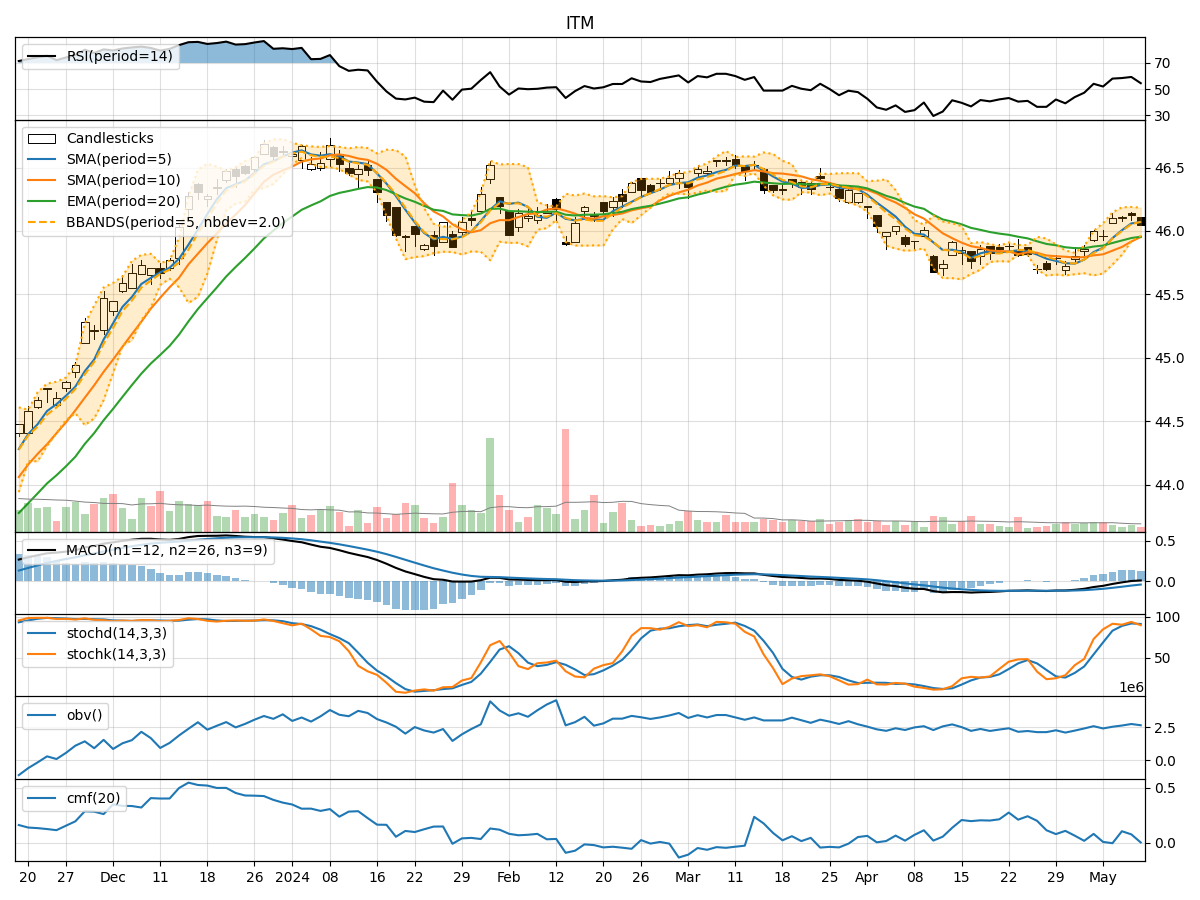
In analyzing the provided Technical Analysis (TA) data for the last 5 days, we will delve into the trend, momentum, volatility, and volume indicators to forecast the possible stock price movement for the next few days. By examining these key indicators, we aim to provide a comprehensive and insightful analysis to guide your decision-making process.
Trend Indicators:
- Moving Averages (MA): The 5-day Moving Average (MA) has been consistently above the Simple Moving Average (SMA) and Exponential Moving Average (EMA), indicating a bullish trend.
- MACD: The MACD line has been positive for the past 5 days, with the MACD Histogram also showing an upward trend, suggesting bullish momentum.
- Conclusion: The trend indicators point towards an upward movement in the stock price.
Momentum Indicators:
- RSI: The Relative Strength Index (RSI) has been gradually increasing and is currently in the neutral zone, indicating potential room for further upside.
- Stochastic Oscillator: Both %K and %D lines of the Stochastic Oscillator are in the overbought region, suggesting a potential reversal or consolidation.
- Conclusion: The momentum indicators suggest a mixed outlook, with a possibility of a short-term pullback or consolidation.
Volatility Indicators:
- Bollinger Bands (BB): The stock price has been trading within the Bollinger Bands, with the bands narrowing, indicating decreasing volatility.
- Conclusion: Volatility is decreasing, which could lead to a period of sideways movement or consolidation in the stock price.
Volume Indicators:
- On-Balance Volume (OBV): The OBV has shown a mixed trend over the past 5 days, indicating indecision among market participants.
- Chaikin Money Flow (CMF): The CMF has been positive but relatively flat, suggesting a neutral sentiment.
- Conclusion: Volume indicators reflect a neutral stance, with no clear direction in terms of buying or selling pressure.
Overall Conclusion:
Based on the analysis of the trend, momentum, volatility, and volume indicators, the next few days' possible stock price movement is likely to be sideways or consolidation with a slight upward bias. While the trend indicators signal an upward trajectory, the momentum indicators hint at a potential pullback or consolidation. The decreasing volatility and neutral volume indicators further support the expectation of a period of sideways movement in the stock price.
Recommendation:
Given the mixed signals from the various technical indicators, it is advisable to closely monitor the stock price movement in the coming days for clearer signals. Consider setting tight stop-loss levels to manage risk effectively in case of unexpected price fluctuations. Additionally, staying informed about any significant market developments or news that could impact the stock's performance is crucial for making well-informed trading decisions.