Technical Analysis of ITOT 2024-05-10
Overview:
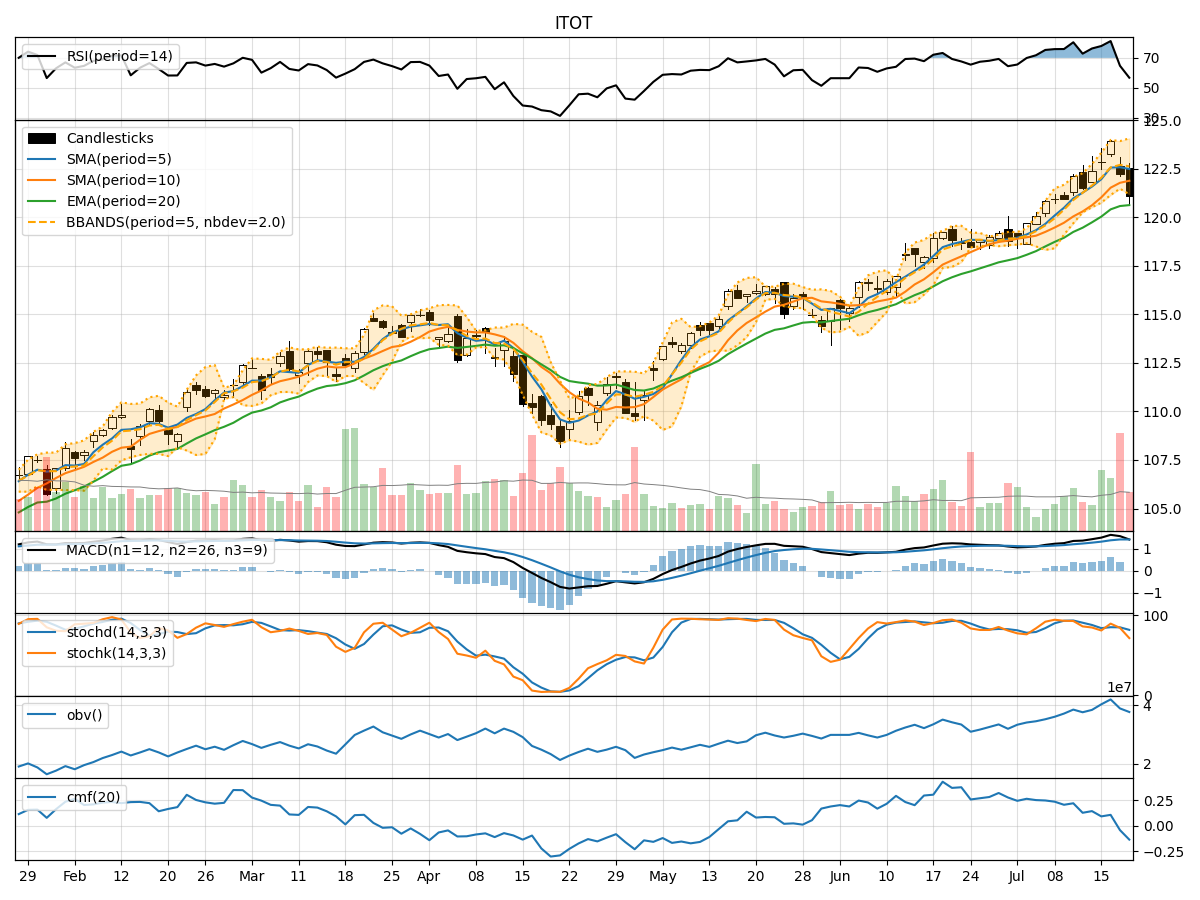
In the last 5 trading days, the ITOT stock has shown a consistent uptrend in both price and volume. The moving averages have been trending upwards, indicating a bullish sentiment. Momentum indicators like RSI and Stochastic oscillators suggest the stock is in overbought territory but still have room for potential upside. Volatility indicators show a narrowing of the Bollinger Bands, indicating a possible decrease in volatility. Volume indicators have been relatively stable, showing consistent buying pressure.
Trend Indicators Analysis:
- Moving Averages (MA): The 5-day MA has been consistently above the 10-day SMA, indicating a short-term bullish trend. The EMA(20) has been steadily increasing, supporting the bullish sentiment.
- MACD: The MACD line has been above the signal line for the past 5 days, indicating positive momentum. The MACD histogram has been increasing, suggesting strengthening bullish momentum.
Momentum Indicators Analysis:
- RSI: The RSI has been in the overbought territory, indicating a potential reversal or consolidation. However, it's important to note that stocks can remain overbought for extended periods during strong uptrends.
- Stochastic Oscillator: Both %K and %D lines have been in the overbought zone, suggesting a potential pullback. However, overbought conditions can persist in strong uptrends.
Volatility Indicators Analysis:
- Bollinger Bands: The narrowing of the Bollinger Bands suggests decreasing volatility and a possible period of consolidation. A breakout from this tightening range could signal the next directional move.
Volume Indicators Analysis:
- On-Balance Volume (OBV): The OBV has been steadily increasing, indicating consistent buying pressure. This aligns with the uptrend seen in price action.
- Chaikin Money Flow (CMF): The CMF has been negative, indicating some distribution. However, the magnitude of the CMF is not significant, suggesting that buying pressure is still dominant.
Conclusion:
Based on the technical indicators and analysis: - Trend: The stock is in a strong upward trend, supported by moving averages and MACD. - Momentum: While momentum indicators suggest overbought conditions, the uptrend could still have room to continue before a potential pullback. - Volatility: The narrowing Bollinger Bands indicate a period of consolidation, with a potential breakout in either direction. - Volume: The consistent increase in OBV signals ongoing accumulation despite some distribution indicated by CMF.
Overall Assessment:
Given the current technical outlook, the stock is likely to continue its upward trajectory in the near term. However, traders should be cautious of potential overbought conditions and a possible period of consolidation or minor pullback before further upside. Consider holding onto long positions with a close eye on key support levels and potential breakout points for optimal risk management.