Technical Analysis of IUS 2024-05-10
Overview:
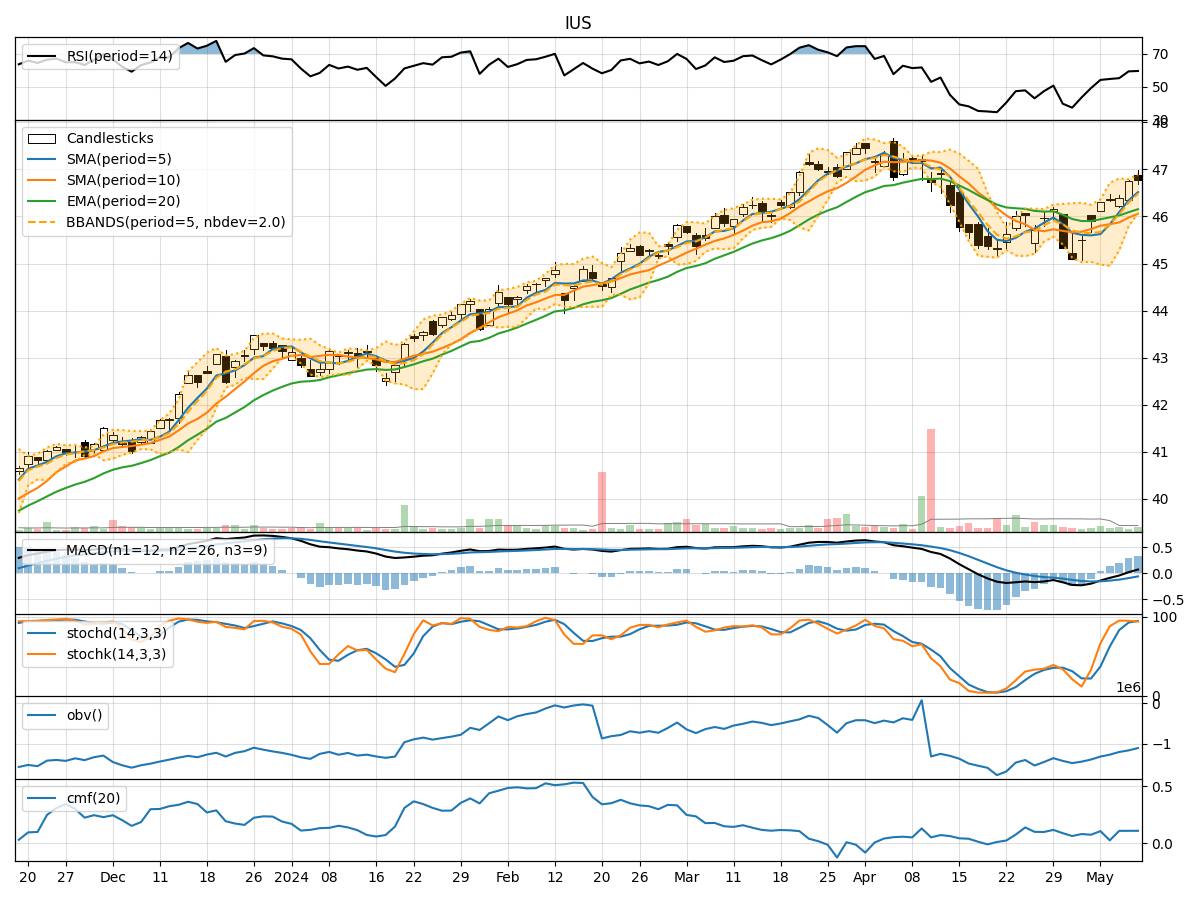
In analyzing the technical indicators for IUS stock over the last 5 days, we will delve into the trend, momentum, volatility, and volume indicators to provide a comprehensive outlook on the possible stock price movement in the coming days. By examining these key indicators, we aim to offer valuable insights and predictions for informed decision-making.
Trend Analysis:
- Moving Averages (MA): The 5-day Moving Average (MA) has been consistently rising, indicating a bullish trend in the short term.
- MACD: The MACD line has been positive and increasing, suggesting upward momentum in the stock price.
- RSI: The Relative Strength Index (RSI) has been trending upwards, reflecting increasing buying pressure.
Momentum Analysis:
- Stochastic Oscillator: Both %K and %D values have been high, indicating that the stock is in overbought territory.
- Williams %R: The Williams %R is in the oversold region, suggesting a potential reversal in the stock price.
Volatility Analysis:
- Bollinger Bands (BB): The Bollinger Bands have been narrowing, indicating decreasing volatility in the stock price.
- Average True Range (ATR): The ATR has been decreasing, further confirming the reduced volatility.
Volume Analysis:
- On-Balance Volume (OBV): The OBV has been declining, signaling a decrease in buying pressure.
- Chaikin Money Flow (CMF): The CMF has been relatively stable, indicating a neutral money flow trend.
Key Observations:
- The trend indicators suggest a bullish sentiment in the short term.
- Momentum indicators show conflicting signals with overbought and oversold conditions.
- Volatility indicators point towards decreasing volatility in the stock price.
- Volume indicators indicate a decrease in buying pressure.
Conclusion:
Based on the analysis of the technical indicators, the next few days' possible stock price movement for IUS is likely to be sideways with a slight upward bias. While the trend indicators are bullish, the conflicting signals from momentum indicators and decreasing buying pressure from volume indicators suggest a potential consolidation phase. Additionally, the decreasing volatility indicates a stable price movement in the near term. Traders should exercise caution and closely monitor key support and resistance levels for potential trading opportunities.