Technical Analysis of IUSB 2024-05-10
Overview:
In analyzing the technical indicators for IUSB over the last 5 days, we will delve into the trend, momentum, volatility, and volume indicators to provide a comprehensive outlook on the possible stock price movement. By examining these key aspects, we aim to offer valuable insights and predictions for the upcoming days.
Trend Analysis:
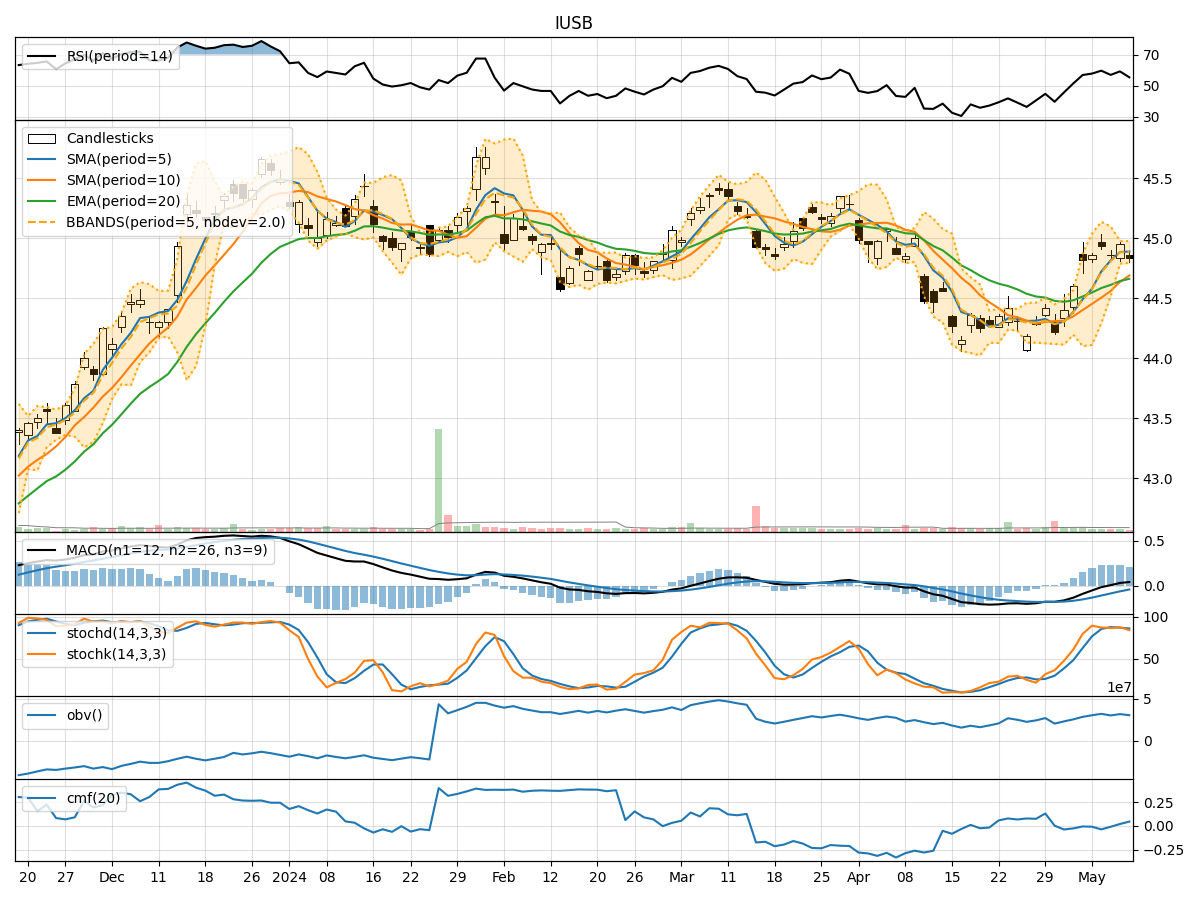
- Moving Averages (MA): The 5-day Moving Average (MA) has been consistently above the Simple Moving Average (SMA) and Exponential Moving Average (EMA), indicating a bullish trend.
- MACD: The MACD line has been consistently above the signal line, with both lines showing an upward trend, suggesting bullish momentum.
- RSI: The Relative Strength Index (RSI) has been fluctuating around the 50 level, indicating a neutral stance in terms of momentum.
Momentum Analysis:
- Stochastic Oscillator: The Stochastic Oscillator has been hovering in the overbought territory, suggesting a potential reversal or consolidation phase.
- Williams %R: The Williams %R indicator has been consistently in the oversold region, indicating a bearish sentiment.
Volatility Analysis:
- Bollinger Bands (BB): The Bollinger Bands have shown a narrowing of the bands, indicating decreasing volatility and a potential period of consolidation.
- Average True Range (ATR): The ATR has shown a decrease in volatility over the last few days, signaling a possible stabilization in price movements.
Volume Analysis:
- On-Balance Volume (OBV): The OBV has been fluctuating, indicating indecision among market participants regarding the stock.
- Chaikin Money Flow (CMF): The CMF has been negative, suggesting a lack of buying pressure in the market.
Conclusion:
Based on the analysis of the technical indicators, the stock of IUSB is likely to experience sideways movement in the next few days. The trend indicators point towards a bullish bias, supported by the MACD and moving averages. However, the momentum indicators, particularly the Stochastic Oscillator and Williams %R, suggest a potential consolidation or pullback in the short term. The volatility indicators indicate a decrease in volatility, which aligns with the expectation of sideways movement. The volume indicators reflect mixed signals, indicating a lack of clear direction in terms of buying pressure.
In conclusion, while the overall trend remains bullish, the conflicting signals from momentum and volume indicators suggest a period of consolidation or sideways movement for IUSB in the near future. Traders and investors should closely monitor key support and resistance levels for potential entry or exit points, considering the possibility of a temporary pause in the current uptrend.