Technical Analysis of IUSG 2024-05-10
Overview:
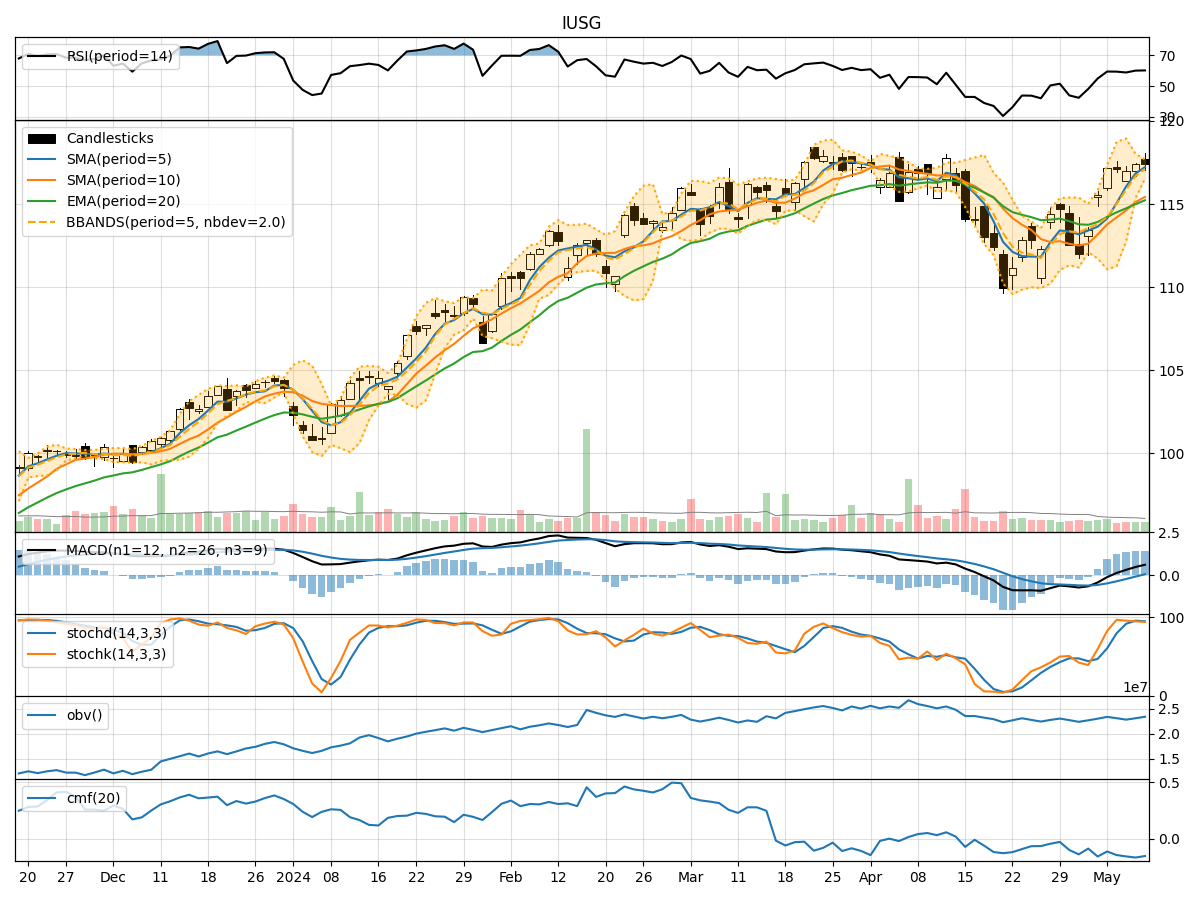
In analyzing the technical indicators for IUSG over the last 5 days, we will delve into the trend, momentum, volatility, and volume indicators to provide a comprehensive outlook on the possible stock price movement in the coming days. By examining these key aspects, we aim to offer valuable insights and predictions to guide your investment decisions.
Trend Indicators:
- Moving Averages (MA): The 5-day Moving Average has been consistently rising, indicating a bullish trend in the short term.
- MACD: The MACD line has been trending upwards, crossing above the signal line, suggesting a potential bullish momentum.
- EMA: The Exponential Moving Average has been steadily increasing, supporting the bullish trend.
Key Observation: The trend indicators point towards a bullish sentiment in the stock price movement.
Momentum Indicators:
- RSI: The Relative Strength Index has been hovering around the overbought territory, indicating strong buying momentum.
- Stochastic Oscillator: Both %K and %D have been at elevated levels, signaling potential overbought conditions.
- Williams %R: The Williams %R is in the oversold region, suggesting a possible reversal in the short term.
Key Observation: Momentum indicators reflect a mixed sentiment with signs of overbought conditions.
Volatility Indicators:
- Bollinger Bands: The stock price has been trading within the upper Bollinger Band, indicating increased volatility.
- Bollinger %B: The %B indicator is above 0.8, suggesting the stock is trading at the upper range of volatility.
- Bollinger Band Width: The Band Width has widened, indicating increased price volatility.
Key Observation: Volatility indicators signal increased volatility in the stock price.
Volume Indicators:
- On-Balance Volume (OBV): The OBV has been fluctuating, indicating indecision among investors.
- Chaikin Money Flow (CMF): The CMF has been negative, suggesting selling pressure in the stock.
Key Observation: Volume indicators reflect mixed sentiment with no clear direction.
Conclusion:
Based on the analysis of the technical indicators, the stock price of IUSG is likely to experience increased volatility in the coming days. While the trend indicators suggest a bullish sentiment, the momentum indicators show signs of overbought conditions. The volume indicators indicate indecisiveness among investors, further adding to the uncertainty.
Considering the overall picture, it is crucial to monitor the price action closely for any signs of a reversal or continuation of the current trend. Investors should exercise caution and consider implementing risk management strategies to navigate the potential market fluctuations ahead.