Technical Analysis of IUSV 2024-05-10
Overview:
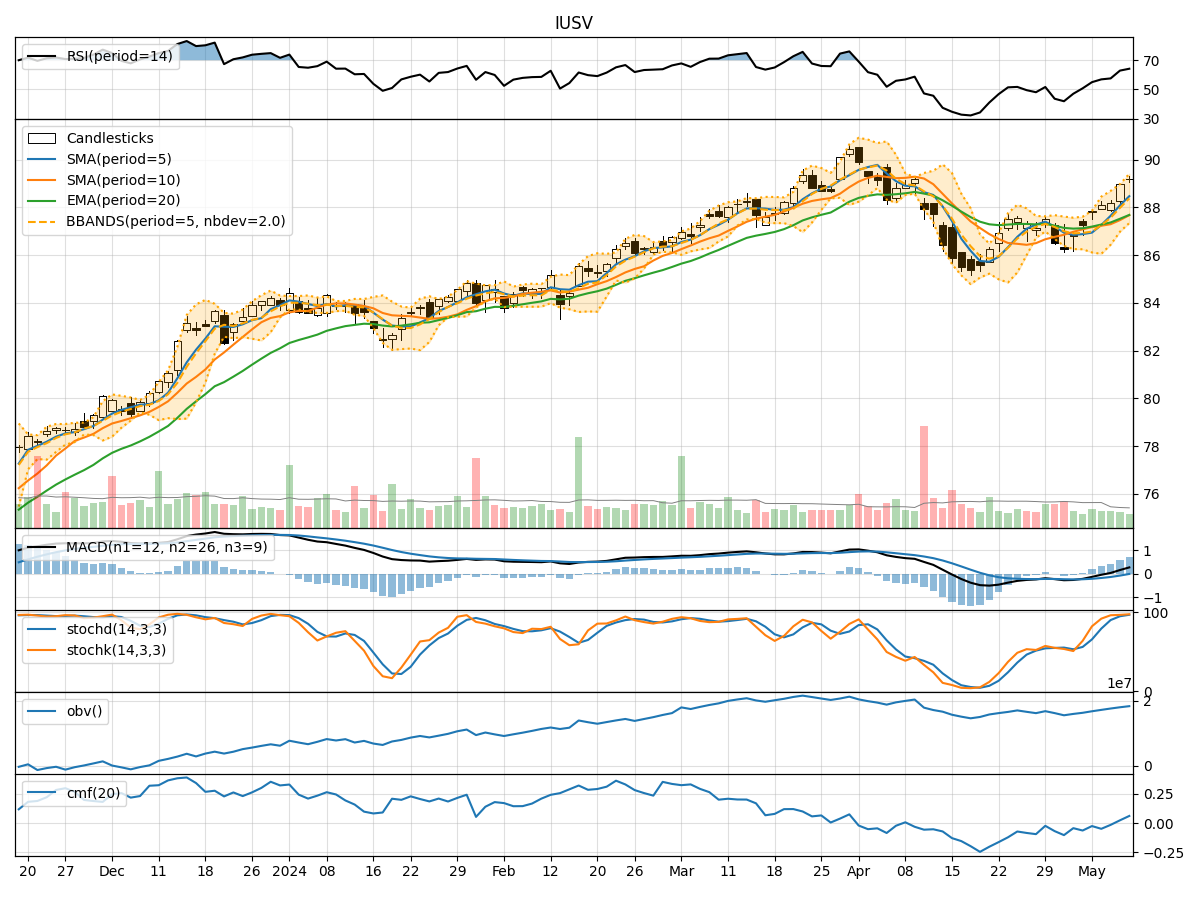
In analyzing the technical indicators for IUSV over the last 5 days, we will delve into the trend, momentum, volatility, and volume indicators to provide a comprehensive outlook on the possible stock price movement in the coming days.
Trend Indicators:
- Moving Averages (MA): The 5-day MA has been consistently above the closing prices, indicating a short-term uptrend.
- MACD: The MACD line has been above the signal line, suggesting bullish momentum.
- RSI: The RSI has been trending upwards, indicating increasing buying pressure.
Momentum Indicators:
- Stochastic Oscillator: Both %K and %D have been in overbought territory, signaling a potential reversal.
- Williams %R: The indicator has been in oversold territory, suggesting a possible buying opportunity.
Volatility Indicators:
- Bollinger Bands: The stock price has been trading near the upper Bollinger Band, indicating overbought conditions.
- BB% (Bollinger Band %B): The %B is above 0.8, suggesting a potential overvaluation.
Volume Indicators:
- On-Balance Volume (OBV): The OBV has been trending upwards, indicating accumulation by investors.
- Chaikin Money Flow (CMF): The CMF has been negative, signaling distribution.
Key Observations:
- The trend indicators suggest a bullish sentiment in the short term.
- Momentum indicators show signs of potential overbought conditions.
- Volatility indicators point towards a possible overvaluation.
- Volume indicators indicate mixed signals with accumulation in OBV but distribution in CMF.
Conclusion:
Based on the analysis of the technical indicators, the stock price of IUSV is likely to experience a short-term correction or consolidation in the coming days. The momentum indicators suggest a potential reversal from overbought levels, while volatility indicators indicate overbought conditions. The conflicting signals from volume indicators further support the view of a possible correction. Therefore, it is advisable to exercise caution and consider potential profit-taking or wait for a better entry point before considering new positions.