Technical Analysis of IVAL 2024-05-10
Overview:
In analyzing the technical indicators for IVAL over the last 5 days, we will delve into the trend, momentum, volatility, and volume indicators to provide a comprehensive outlook on the possible stock price movement. By examining these key indicators, we aim to offer valuable insights and predictions for the upcoming days.
Trend Analysis:
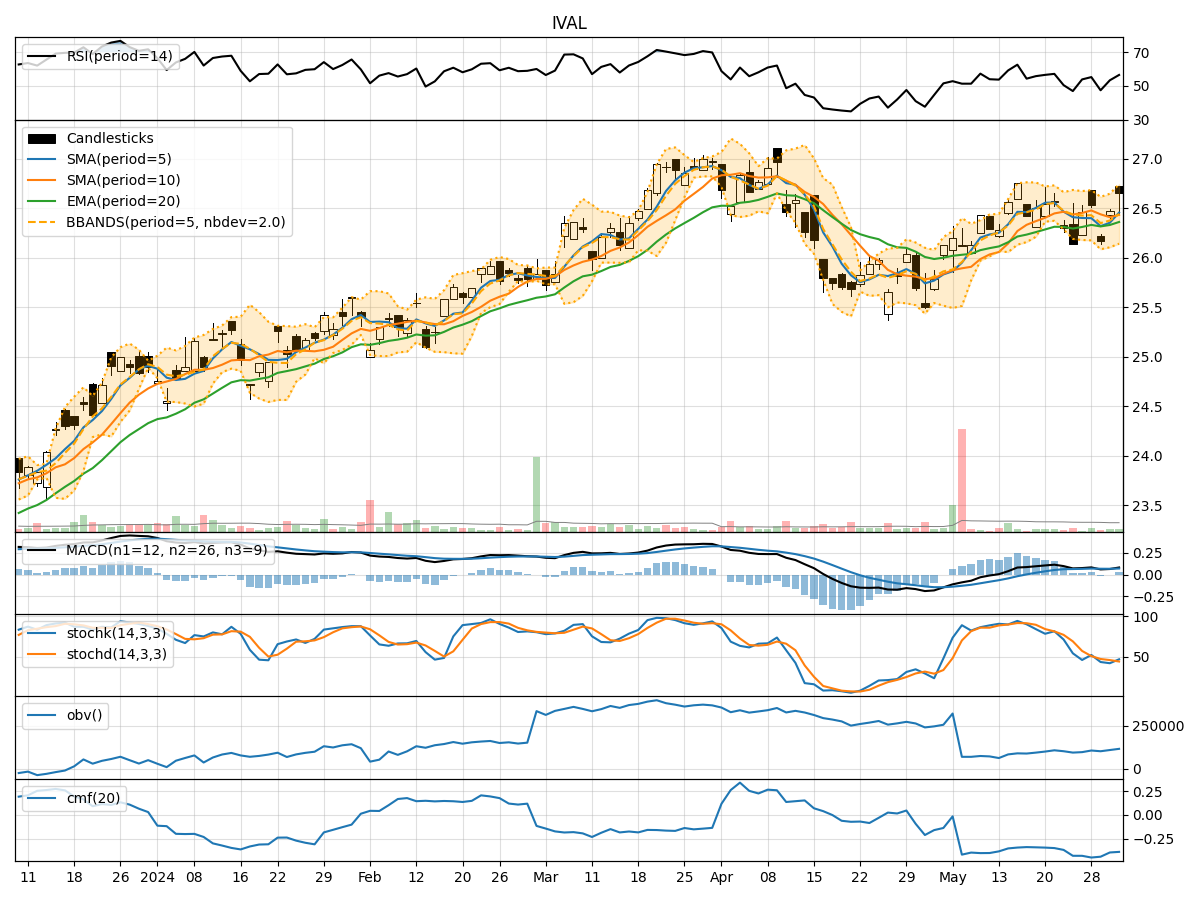
- Moving Averages (MA): The 5-day Moving Average (MA) has been consistently above the Simple Moving Average (SMA) and Exponential Moving Average (EMA) over the past 5 days, indicating a short-term bullish trend.
- MACD: The Moving Average Convergence Divergence (MACD) has been positive, with the MACD line consistently above the Signal line, suggesting bullish momentum.
- Conclusion: The trend indicators point towards an upward trend in the stock price.
Momentum Analysis:
- RSI: The Relative Strength Index (RSI) has been fluctuating around the 50 level, indicating a neutral momentum in the stock.
- Stochastic Oscillator: Both %K and %D have been in the overbought zone, suggesting a potential reversal in momentum.
- Conclusion: The momentum indicators suggest a neutral to slightly bearish outlook for the stock.
Volatility Analysis:
- Bollinger Bands (BB): The stock price has been trading within the Bollinger Bands, with the bands narrowing, indicating decreasing volatility.
- Conclusion: Volatility is decreasing, which could lead to a period of consolidation or a potential breakout in the near future.
Volume Analysis:
- On-Balance Volume (OBV): The OBV has been relatively flat over the past 5 days, indicating a balance between buying and selling pressure.
- Chaikin Money Flow (CMF): The CMF has been negative, suggesting a slight distribution phase.
- Conclusion: The volume indicators imply a neutral sentiment in the market.
Overall Conclusion:
Based on the analysis of the technical indicators, the stock of IVAL is likely to experience sideways movement in the upcoming days. The trend indicators point towards an upward bias, while momentum indicators suggest a neutral to slightly bearish outlook. Volatility is decreasing, indicating a potential consolidation phase, and volume indicators reflect a neutral sentiment.
Recommendation:
Considering the mixed signals from the technical indicators, it is advisable for investors to exercise caution and closely monitor the stock price movement. Traders may consider implementing range-bound strategies to capitalize on potential price fluctuations within the sideways trend. Additionally, keeping an eye on key support and resistance levels can help in making informed trading decisions.
In conclusion, while the trend indicates upward momentum, the overall market sentiment appears to be neutral, suggesting a period of consolidation or sideways movement for IVAL in the near term.