Technical Analysis of IVEG 2024-05-10
Overview:
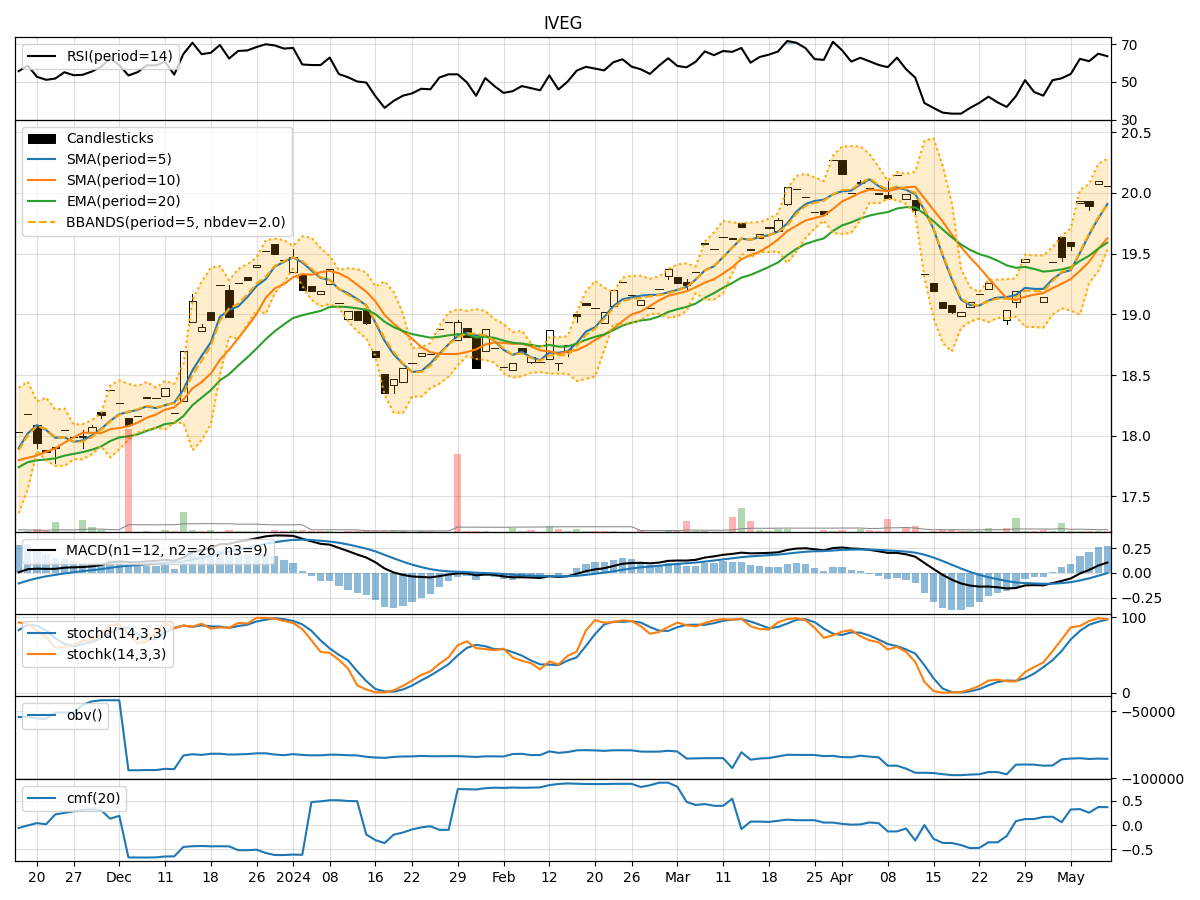
In analyzing the technical indicators for IVEG over the last 5 days, we will delve into the trend, momentum, volatility, and volume indicators to provide a comprehensive outlook on the possible stock price movement in the coming days. By examining these key aspects, we aim to offer valuable insights and predictions to guide your investment decisions.
Trend Indicators:
- Moving Averages (MA): The 5-day MA has been consistently above the closing prices, indicating a short-term uptrend.
- MACD: The MACD line has been above the signal line, suggesting bullish momentum.
- RSI: The RSI has been fluctuating around the neutral zone, indicating a balanced market sentiment.
Momentum Indicators:
- Stochastic Oscillator: Both %K and %D have been in overbought territory, signaling a potential reversal.
- Williams %R: The indicator has been hovering in oversold territory, suggesting a possible buying opportunity.
Volatility Indicators:
- Bollinger Bands: The stock price has been trading within the bands, indicating a period of consolidation.
- Average True Range (ATR): The ATR has shown relatively stable volatility levels over the past few days.
Volume Indicators:
- On-Balance Volume (OBV): The OBV has been fluctuating, indicating mixed buying and selling pressure.
- Chaikin Money Flow (CMF): The CMF has been positive, suggesting accumulation by investors.
Key Observations:
- The trend indicators point towards a bullish sentiment in the short term.
- Momentum indicators show conflicting signals, with stochastic indicating overbought conditions and Williams %R suggesting oversold levels.
- Volatility remains relatively stable, indicating a period of consolidation.
- Volume indicators reflect mixed market participation, with OBV fluctuating and CMF showing accumulation.
Conclusion:
Based on the analysis of the technical indicators, the stock price of IVEG is likely to experience further upward movement in the coming days. The bullish trend indicated by moving averages and MACD, coupled with stable volatility levels and positive CMF, suggest a favorable outlook for the stock. However, investors should remain cautious of potential overbought conditions highlighted by the stochastic oscillator. Overall, the short-term outlook for IVEG appears bullish with a potential for further price appreciation.