Technical Analysis of IVES 2024-05-10
Overview:
In analyzing the provided technical indicators for the last 5 days, we will delve into the trend, momentum, volatility, and volume indicators to forecast the possible stock price movement for the next few days. By examining these key aspects, we aim to provide a comprehensive and insightful prediction backed by data-driven analysis.
Trend Indicators:
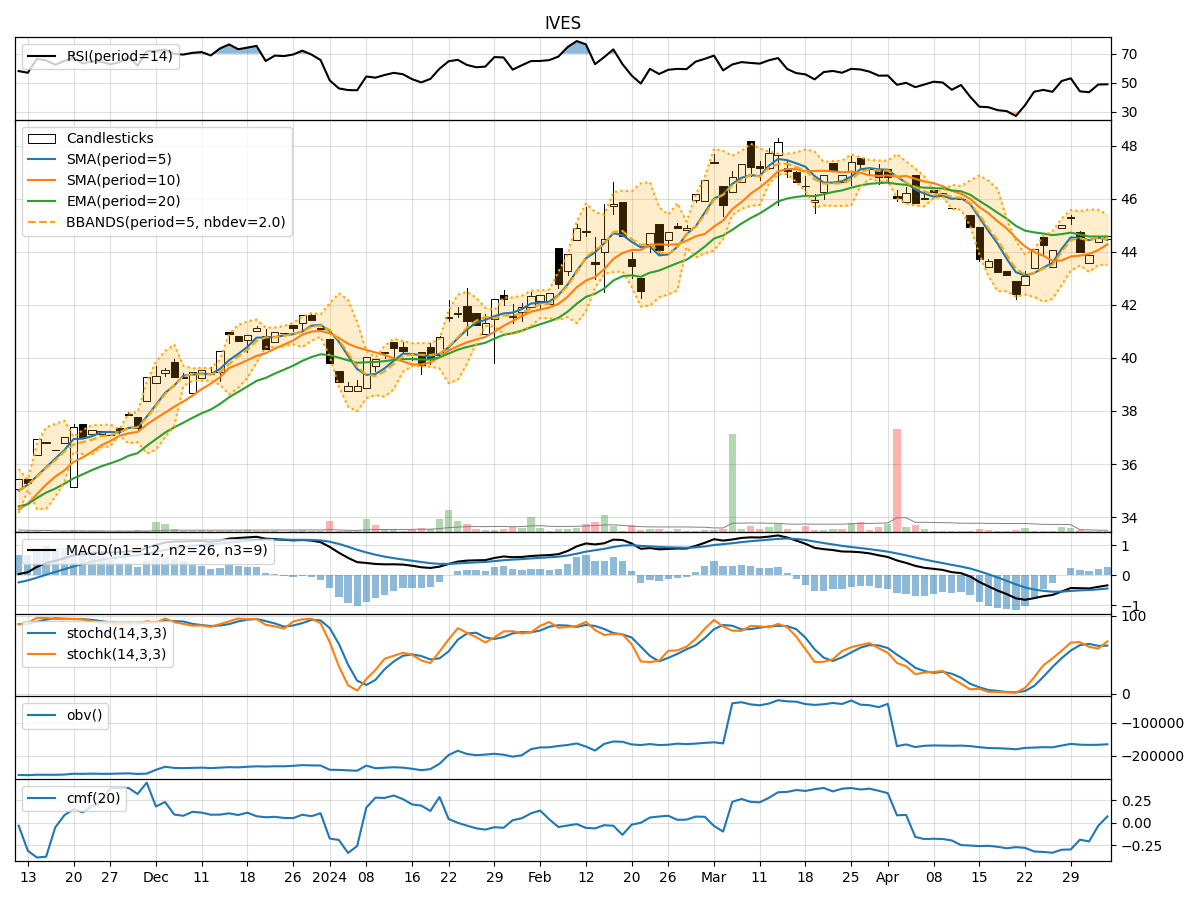
- Moving Averages (MA): The 5-day moving average has been fluctuating around the closing prices, indicating short-term price trends. The Simple Moving Average (SMA) and Exponential Moving Average (EMA) show a slight upward trend.
- Moving Average Convergence Divergence (MACD): The MACD line has been negative, but the MACD Histogram is showing signs of convergence towards the signal line.
- Conclusion: The trend indicators suggest a neutral to slightly bullish outlook for the stock price.
Momentum Indicators:
- Relative Strength Index (RSI): RSI values have been fluctuating around the mid-level, indicating a balanced momentum between buying and selling pressure.
- Stochastic Oscillator: Both %K and %D values have been in the overbought territory, suggesting a potential reversal in momentum.
- Williams %R (WillR): The Williams %R is in the oversold region, indicating a possible buying opportunity.
- Conclusion: Momentum indicators point towards a mixed sentiment with a potential for a short-term reversal.
Volatility Indicators:
- Bollinger Bands (BB): The bands have been narrowing, indicating decreasing volatility in the stock price.
- Conclusion: Volatility indicators suggest a consolidation phase with a potential breakout in either direction.
Volume Indicators:
- On-Balance Volume (OBV): The OBV has shown mixed movements, reflecting indecision among market participants.
- Chaikin Money Flow (CMF): The CMF has been positive, indicating buying pressure in the market.
- Conclusion: Volume indicators imply a neutral stance with a slight inclination towards buying activity.
Overall Conclusion:
Based on the analysis of trend, momentum, volatility, and volume indicators, the next few days' possible stock price movement is likely to be sideways with a slight bullish bias. The trend indicators suggest a potential for a bullish continuation, while momentum indicators indicate a mixed sentiment with a possibility of a short-term reversal. Volatility indicators point towards a consolidation phase, and volume indicators reflect a neutral stance with a slight buying pressure.
Recommendation:
Considering the overall analysis, it is advisable to monitor the stock closely for any breakout from the consolidation phase. Traders may consider buying on dips with proper risk management strategies in place. Additionally, keeping an eye on key support and resistance levels can help in making informed trading decisions.
By combining insights from various technical indicators, investors can better navigate the market dynamics and make well-informed decisions aligned with their investment goals and risk tolerance.