Technical Analysis of IVOG 2024-05-10
Overview:
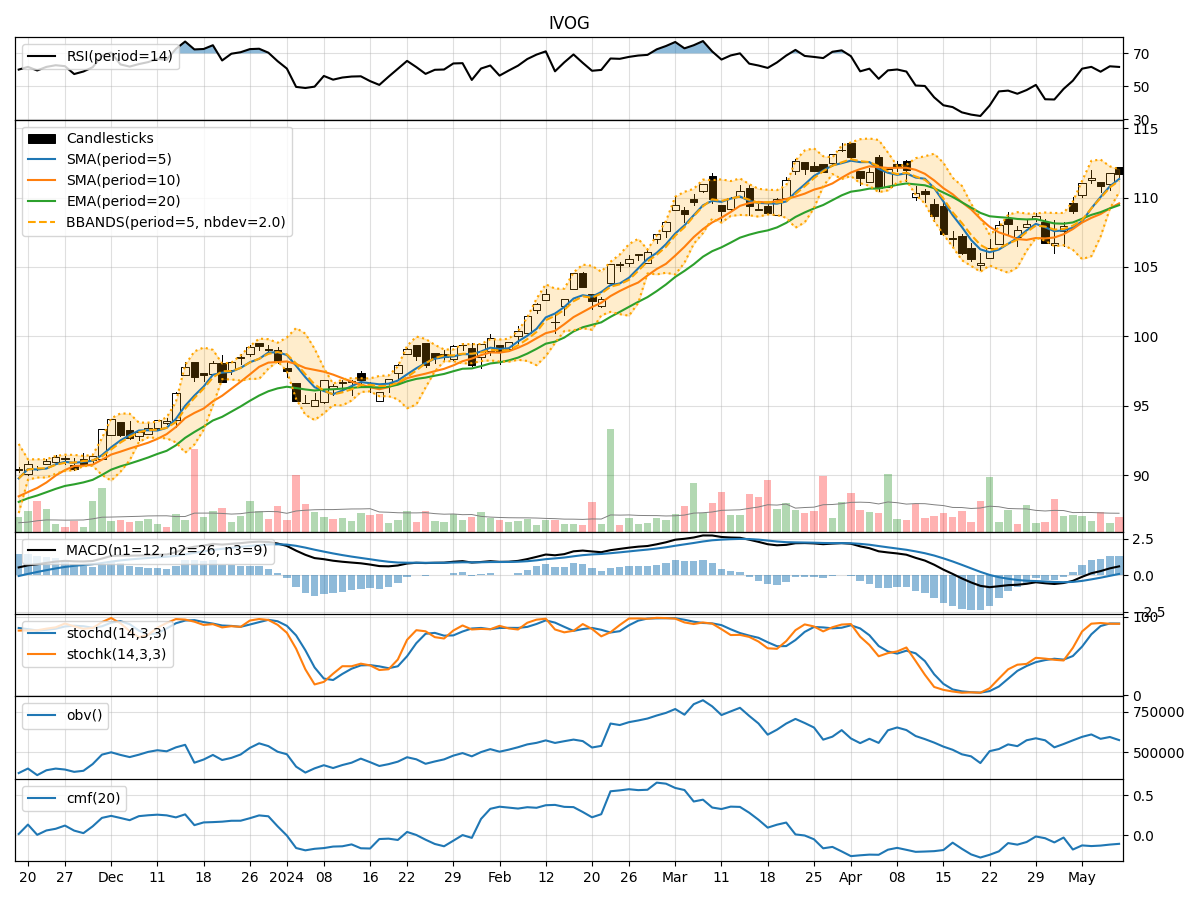
In analyzing the technical indicators for IVOG over the last 5 days, we will delve into the trend, momentum, volatility, and volume indicators to provide a comprehensive outlook on the possible stock price movement in the coming days. By examining these key aspects, we aim to offer valuable insights and predictions to guide your investment decisions.
Trend Analysis:
- Moving Averages (MA): The 5-day Moving Average (MA) has been consistently rising, indicating a bullish trend in the short term.
- MACD: The MACD line has been trending upwards, crossing above the signal line, suggesting a bullish momentum.
- EMA: The Exponential Moving Average (EMA) has also been on an upward trajectory, supporting the bullish sentiment.
Momentum Analysis:
- RSI: The Relative Strength Index (RSI) has been hovering around the neutral zone, indicating a balanced momentum.
- Stochastic Oscillator: Both %K and %D have been relatively high, suggesting a bullish momentum.
- Williams %R: The Williams %R is in the oversold territory, signaling a potential buying opportunity.
Volatility Analysis:
- Bollinger Bands (BB): The stock price has been trading within the Bollinger Bands, indicating normal volatility.
- BB Width: The Bollinger Bands Width has been narrowing, suggesting a potential decrease in volatility.
- BB %B: The %B indicator is around the middle range, reflecting a balanced volatility level.
Volume Analysis:
- On-Balance Volume (OBV): The OBV has been fluctuating, indicating mixed buying and selling pressure.
- Chaikin Money Flow (CMF): The CMF has been negative, suggesting a bearish money flow trend.
Conclusion:
Based on the analysis of the technical indicators, the stock of IVOG is likely to experience further upward movement in the coming days. The bullish trend indicated by the moving averages and MACD, coupled with the positive momentum from the Stochastic Oscillator, supports this outlook. While there may be some short-term fluctuations due to normal volatility, the overall trend is expected to be bullish. Traders may consider entering long positions to capitalize on the potential upside momentum.