Technical Analysis of IVRA 2024-05-10
Overview:
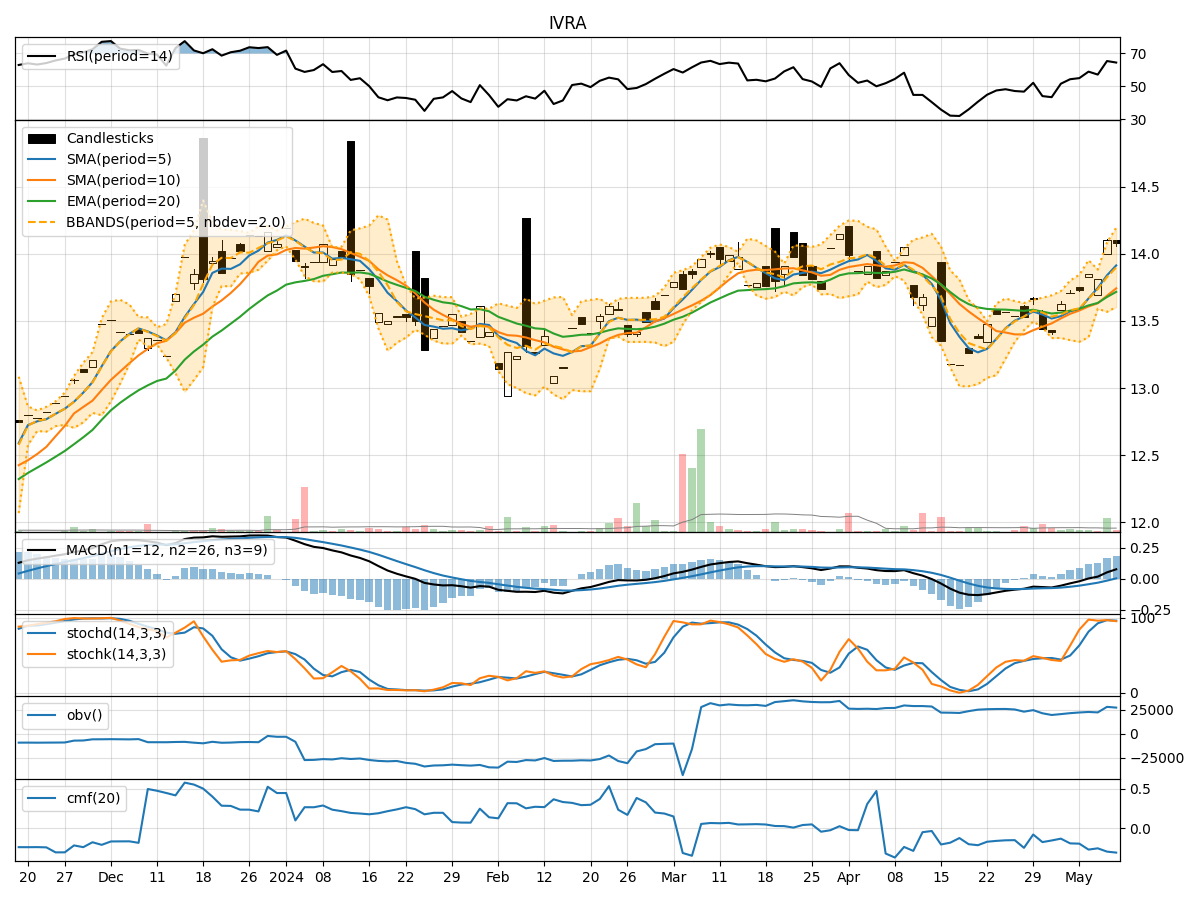
In analyzing the technical indicators for IVRA stock over the last 5 days, we will delve into the trends, momentum, volatility, and volume indicators to provide a comprehensive outlook on the possible stock price movement in the coming days. By examining these key aspects, we aim to offer valuable insights and predictions for informed decision-making.
Trend Indicators:
- Moving Averages (MA): The 5-day MA has been consistently above the closing prices, indicating a short-term uptrend.
- MACD: The MACD line has been positive and increasing, suggesting bullish momentum.
- MACD Histogram: The histogram has been rising, indicating strengthening bullish momentum.
Key Observation: The trend indicators point towards a bullish sentiment in the short term.
Momentum Indicators:
- RSI: The RSI has been in the neutral to overbought territory, reflecting positive momentum.
- Stochastic Oscillator: Both %K and %D have been in the overbought zone, signaling potential overextension.
- Williams %R: The indicator has been fluctuating around the oversold region, suggesting potential buying opportunities.
Key Observation: Momentum indicators show a mixed signal with a slight bias towards overbought conditions.
Volatility Indicators:
- Bollinger Bands: The stock price has been trading within the bands, indicating normal volatility.
- Bollinger %B: The %B has been fluctuating within the range, suggesting no extreme conditions.
Key Observation: Volatility indicators imply a stable price movement without significant deviations.
Volume Indicators:
- On-Balance Volume (OBV): The OBV has shown slight fluctuations, indicating mixed buying and selling pressure.
- Chaikin Money Flow (CMF): The CMF has been negative, suggesting outflow of money from the stock.
Key Observation: Volume indicators reflect a lack of strong buying interest and a slight bearish sentiment.
Conclusion:
Based on the analysis of the technical indicators, the next few days' possible stock price movement for IVRA is likely to be sideways with a slight bearish bias. While trend indicators suggest a bullish outlook in the short term, momentum indicators indicate potential overbought conditions. Volatility indicators point towards stable price movements, and volume indicators show a lack of strong buying interest.
Key Conclusion: The stock is likely to consolidate in the near term with a potential downside bias. Traders should exercise caution and consider waiting for clearer signals before making significant trading decisions.