Technical Analysis of IVRS 2024-05-10
Overview:
In analyzing the technical indicators for the stock over the last 5 days, we will delve into the trend, momentum, volatility, and volume indicators to provide a comprehensive outlook on the possible stock price movement in the coming days. By examining these key aspects, we aim to offer valuable insights and predictions to guide your investment decisions.
Trend Indicators:
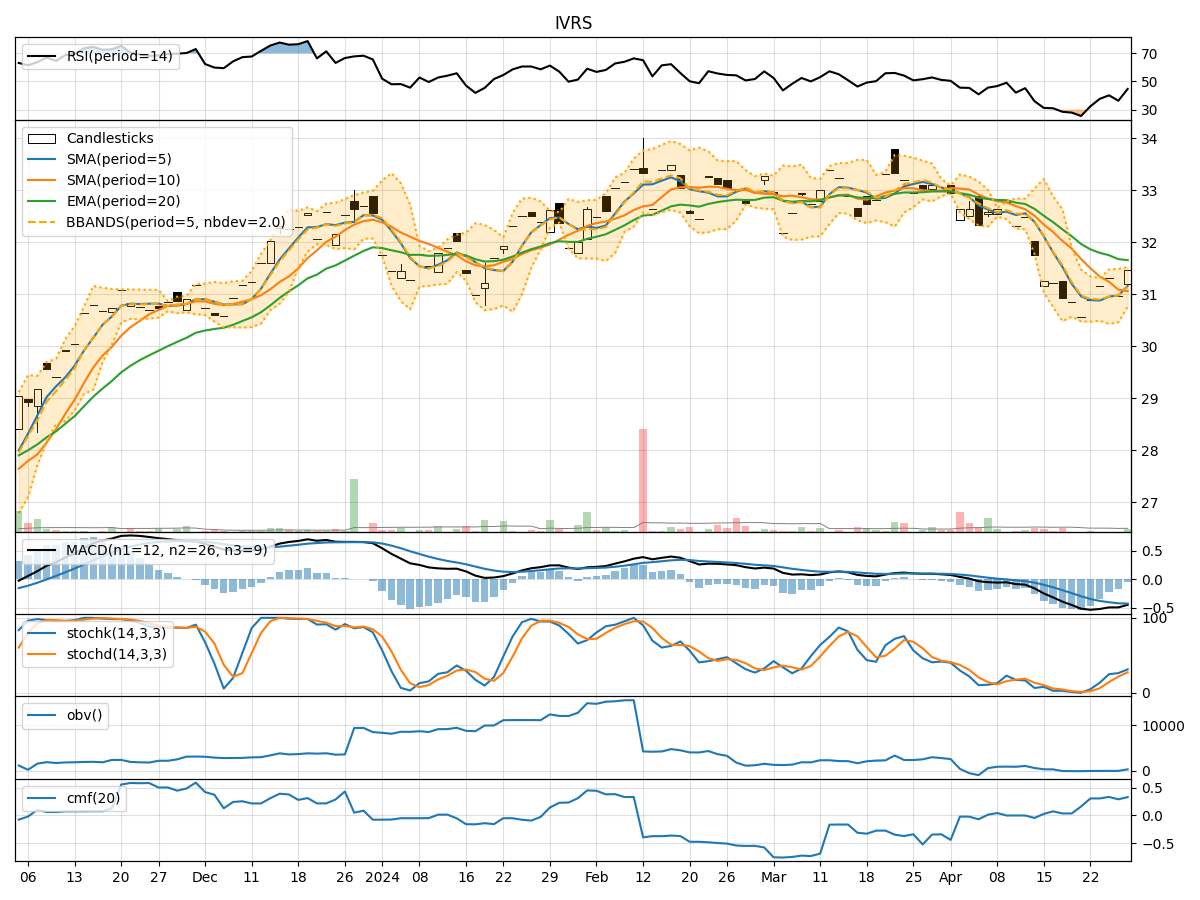
- Moving Averages (MA): The 5-day Moving Average (MA) has been consistently above the Simple Moving Average (SMA) and Exponential Moving Average (EMA), indicating a bullish trend.
- MACD: The Moving Average Convergence Divergence (MACD) has been positive, with the MACD line above the signal line, suggesting upward momentum.
- MACD Histogram: The MACD Histogram has been increasing, reflecting strengthening bullish momentum.
Momentum Indicators:
- RSI: The Relative Strength Index (RSI) has been in the neutral zone, indicating neither overbought nor oversold conditions.
- Stochastic Oscillator: Both %K and %D have been declining, signaling a potential reversal in momentum to the downside.
- Williams %R: The Williams %R is in the oversold territory, suggesting a possible buying opportunity.
Volatility Indicators:
- Bollinger Bands: The stock price has been trading within the Bollinger Bands, with the bands narrowing, indicating decreasing volatility.
- Bollinger %B: The %B indicator is hovering around the middle range, suggesting a balanced market sentiment.
Volume Indicators:
- On-Balance Volume (OBV): The OBV has been declining, indicating selling pressure in the stock.
- Chaikin Money Flow (CMF): The CMF has been negative, reflecting a lack of buying interest in the stock.
Key Observations and Opinions:
- Trend: The stock is currently in an upward trend based on moving averages and MACD analysis.
- Momentum: Momentum indicators suggest a potential reversal to the downside as the stochastic oscillator and Williams %R indicate oversold conditions.
- Volatility: Volatility has been decreasing, indicating a possible period of consolidation.
- Volume: The declining OBV and negative CMF point towards bearish sentiment in the stock.
Conclusion:
Based on the analysis of the technical indicators, the stock is likely to experience short-term consolidation or a minor pullback in the coming days. Traders should exercise caution and consider waiting for clearer signals before making significant trading decisions. The overall outlook leans towards a sideways movement with a slight bearish bias in the near term.