Technical Analysis of IVV 2024-05-10
Overview:
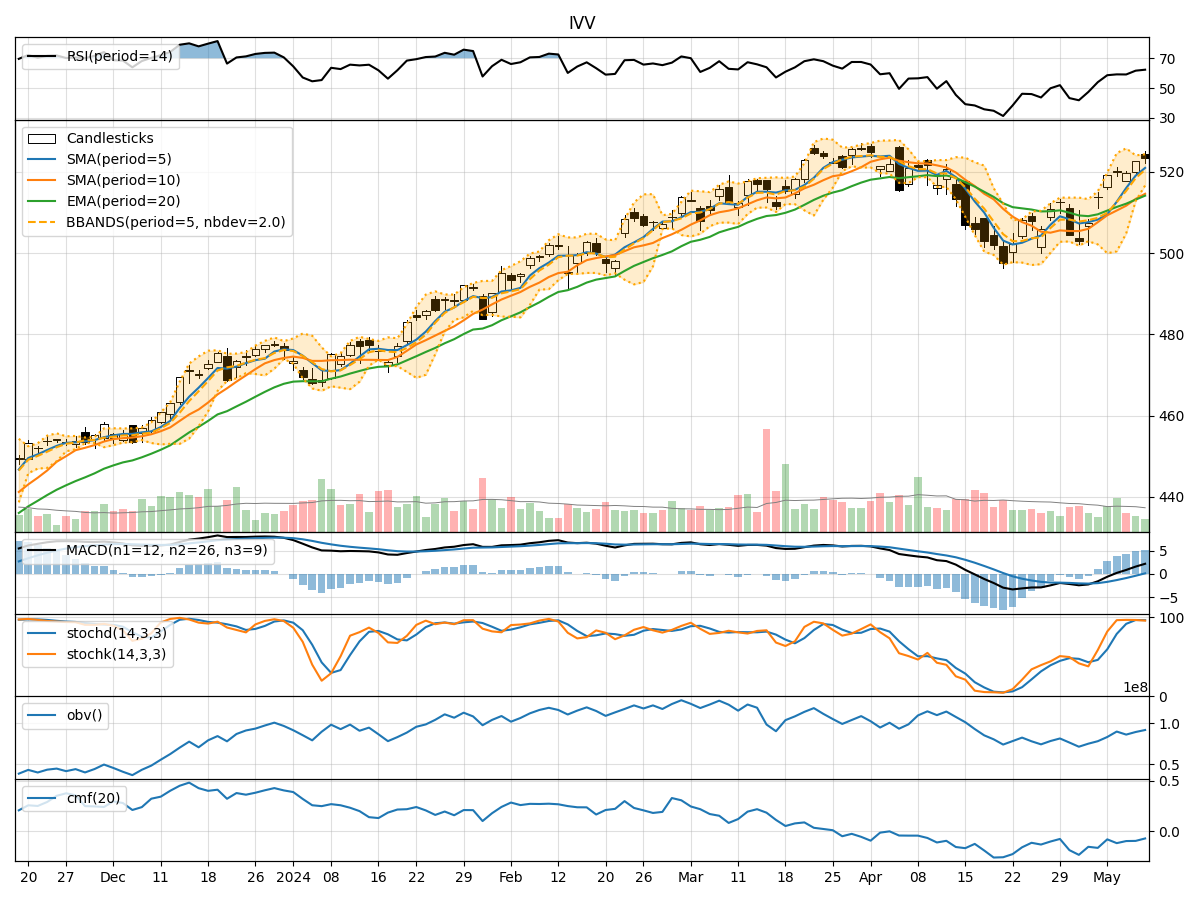
In analyzing the technical indicators for IVV over the last 5 days, we will delve into the trends, momentum, volatility, and volume indicators to provide a comprehensive outlook on the possible stock price movement in the coming days. By examining key metrics such as moving averages, MACD, RSI, Bollinger Bands, and OBV, we aim to offer valuable insights and predictions for informed decision-making.
Trend Indicators:
- Moving Averages (MA): The 5-day MA has been consistently rising, indicating a bullish trend in the short term.
- MACD: The MACD line has been above the signal line, suggesting a bullish momentum.
- EMA: The EMA has been trending upwards, supporting the bullish sentiment.
Momentum Indicators:
- RSI: The RSI has been increasing, showing strengthening buying momentum.
- Stochastic Oscillator: Both %K and %D have been high, indicating overbought conditions.
- Williams %R: The indicator has been in the oversold territory, potentially signaling a reversal.
Volatility Indicators:
- Bollinger Bands: The price has been consistently trading above the middle band, suggesting an uptrend.
- Bollinger %B: The %B indicator has been above 0.5, indicating bullish momentum.
Volume Indicators:
- On-Balance Volume (OBV): The OBV has been declining, suggesting distribution by investors.
- Chaikin Money Flow (CMF): The CMF has been negative, indicating selling pressure.
Key Observations:
- The trend indicators point towards a bullish sentiment in the short term.
- Momentum indicators show a mix of overbought and oversold conditions, signaling potential price reversals.
- Volatility indicators suggest a continuation of the uptrend with bullish momentum.
- Volume indicators indicate a divergence in investor sentiment, with selling pressure evident.
Conclusion:
Based on the analysis of the technical indicators, the next few days for IVV are likely to see continued bullish movement in the stock price. However, caution is advised due to the overbought conditions highlighted by the momentum indicators. Traders should closely monitor price action for potential reversals or corrections. Overall, the outlook remains upward with a possibility of consolidation before further upside potential.