Technical Analysis of IVVB 2024-05-10
Overview:
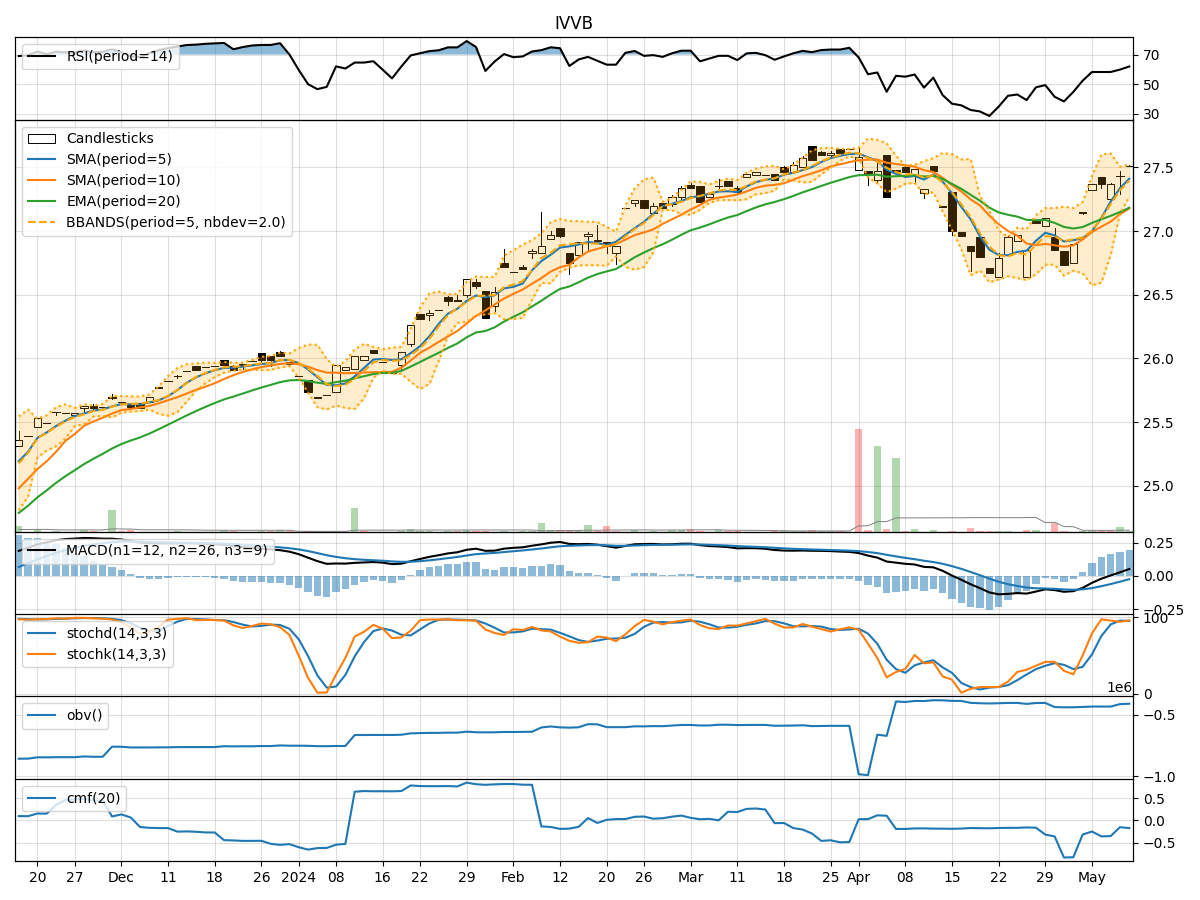
In analyzing the technical indicators for IVVB over the last 5 days, we will delve into the trend, momentum, volatility, and volume indicators to provide a comprehensive outlook on the possible stock price movement in the coming days.
Trend Indicators:
- Moving Averages (MA): The 5-day MA has been consistently above the closing price, indicating a short-term bullish trend.
- MACD: The MACD line has been trending upwards, with the MACD histogram showing positive values, suggesting bullish momentum.
- Relative Strength Index (RSI): The RSI has been increasing, indicating strengthening bullish momentum.
Momentum Indicators:
- Stochastic Oscillator: Both %K and %D have been in the overbought zone, suggesting a strong bullish momentum.
- Williams %R: The indicator has been consistently in the oversold territory, signaling a potential reversal to the upside.
Volatility Indicators:
- Bollinger Bands (BB): The bands have been narrowing, indicating decreasing volatility and a potential price breakout.
- Average True Range (ATR): The ATR has been decreasing, suggesting a decline in price volatility.
Volume Indicators:
- On-Balance Volume (OBV): The OBV has been relatively flat, indicating a balance between buying and selling pressure.
- Chaikin Money Flow (CMF): The CMF has been negative, suggesting a net outflow of money from the stock.
Key Observations and Opinions:
- Trend: The trend indicators point towards a bullish sentiment in the short term.
- Momentum: Strong bullish momentum is evident from the stochastic oscillator and RSI.
- Volatility: Decreasing volatility may precede a significant price movement.
- Volume: The volume indicators show a lack of strong buying or selling pressure.
Conclusion:
Based on the analysis of the technical indicators, the next few days for IVVB are likely to see continued upward movement in the stock price. The bullish trend, strong momentum, and decreasing volatility suggest a potential for further price appreciation. However, caution should be exercised as the volume indicators do not show a clear direction, indicating a possibility of consolidation in the near term. Investors should monitor the price action closely for any signs of a reversal or a breakout.