Technical Analysis of IVVW 2024-05-10
Overview:
In analyzing the technical indicators for IVVW over the last 5 days, we will delve into the trend, momentum, volatility, and volume indicators to provide a comprehensive outlook on the possible stock price movement in the coming days. By examining these key aspects, we aim to offer valuable insights and predictions to guide investment decisions.
Trend Indicators:
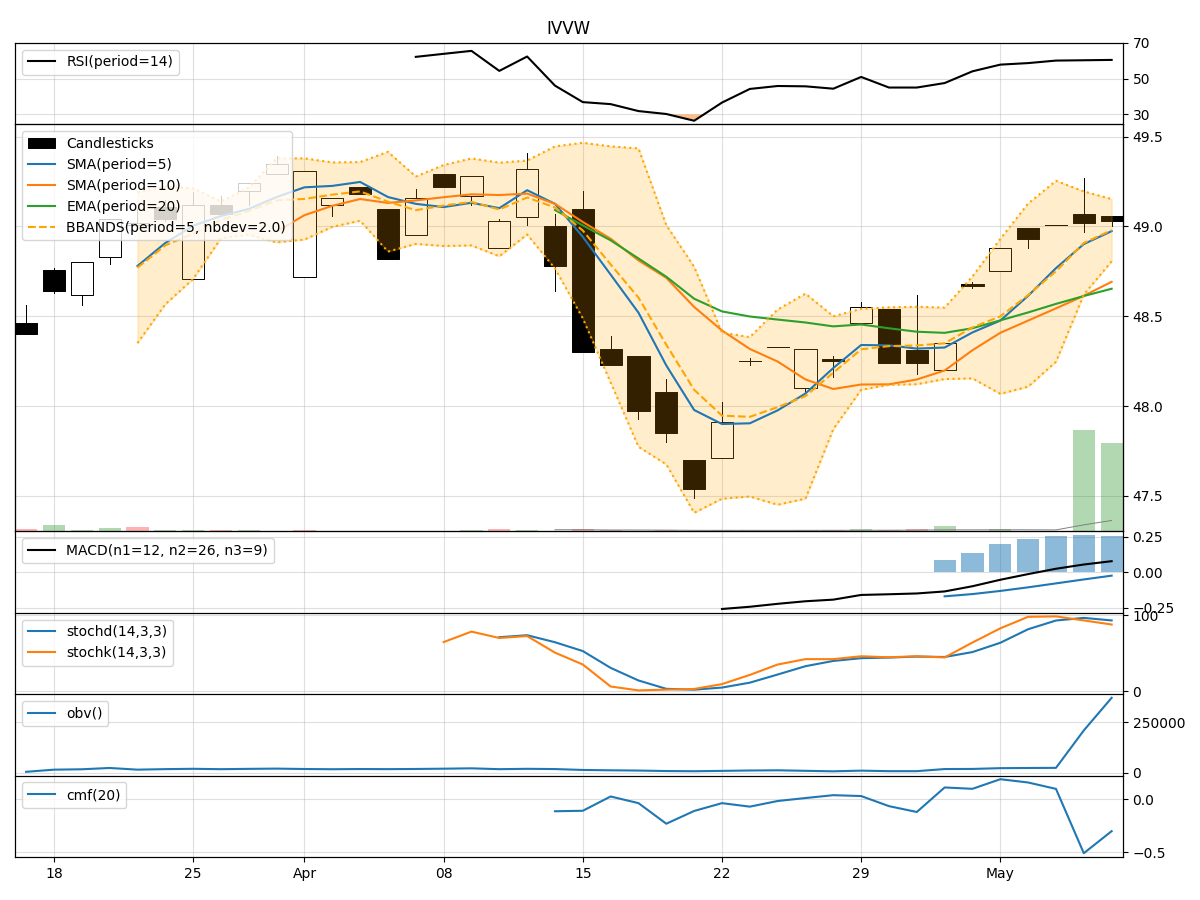
- Moving Averages (MA): The 5-day MA has been consistently above the closing prices, indicating a short-term uptrend.
- MACD: The MACD line has been gradually increasing, with the MACD histogram showing positive values, suggesting bullish momentum.
- EMA: The EMA has been trending upwards, supporting the bullish sentiment in the short to medium term.
Key Observation: The trend indicators point towards a bullish outlook for IVVW in the near future.
Momentum Indicators:
- RSI: The RSI has been in the overbought territory, indicating strong buying momentum.
- Stochastic Oscillator: Both %K and %D have been high, suggesting that the stock is in overbought conditions.
- Williams %R: The indicator has been consistently in the oversold region, signaling a potential reversal.
Key Observation: Momentum indicators suggest that IVVW is currently overbought and may experience a pullback or consolidation soon.
Volatility Indicators:
- Bollinger Bands (BB): The bands have been narrowing, indicating decreasing volatility.
- BB %B: The %B indicator has been hovering around 0.7, suggesting a balanced market sentiment.
- Average True Range (ATR): The ATR has been decreasing, indicating lower volatility levels.
Key Observation: Volatility indicators signal that IVVW is currently experiencing low volatility and may enter a period of consolidation.
Volume Indicators:
- On-Balance Volume (OBV): The OBV has been fluctuating, indicating mixed buying and selling pressure.
- Chaikin Money Flow (CMF): The CMF has been negative, suggesting a bearish money flow trend.
Key Observation: Volume indicators reflect a mixed sentiment in terms of buying and selling pressure.
Conclusion:
Based on the analysis of trend, momentum, volatility, and volume indicators, the overall outlook for IVVW in the next few days is as follows: - Trend: Upward - Momentum: Bearish (potential for a pullback) - Volatility: Consolidation - Volume: Mixed
Recommendation:
Considering the technical indicators and the current market dynamics, it is advisable to exercise caution in trading IVVW in the coming days. Traders should be prepared for a potential pullback in price due to the overbought conditions indicated by the momentum indicators. Additionally, the low volatility and mixed volume signals suggest a period of consolidation may be on the horizon. It is essential to closely monitor the price action and key support/resistance levels to make informed trading decisions.
Disclaimer:
Remember that technical analysis is not a guaranteed predictor of future price movements, and other fundamental factors and market dynamics can influence stock prices. It is crucial to conduct thorough research and consider multiple indicators before making any investment decisions. Consulting with a financial advisor can provide personalized insights tailored to your specific investment goals and risk tolerance level.