Technical Analysis of IWC 2024-05-10
Overview:
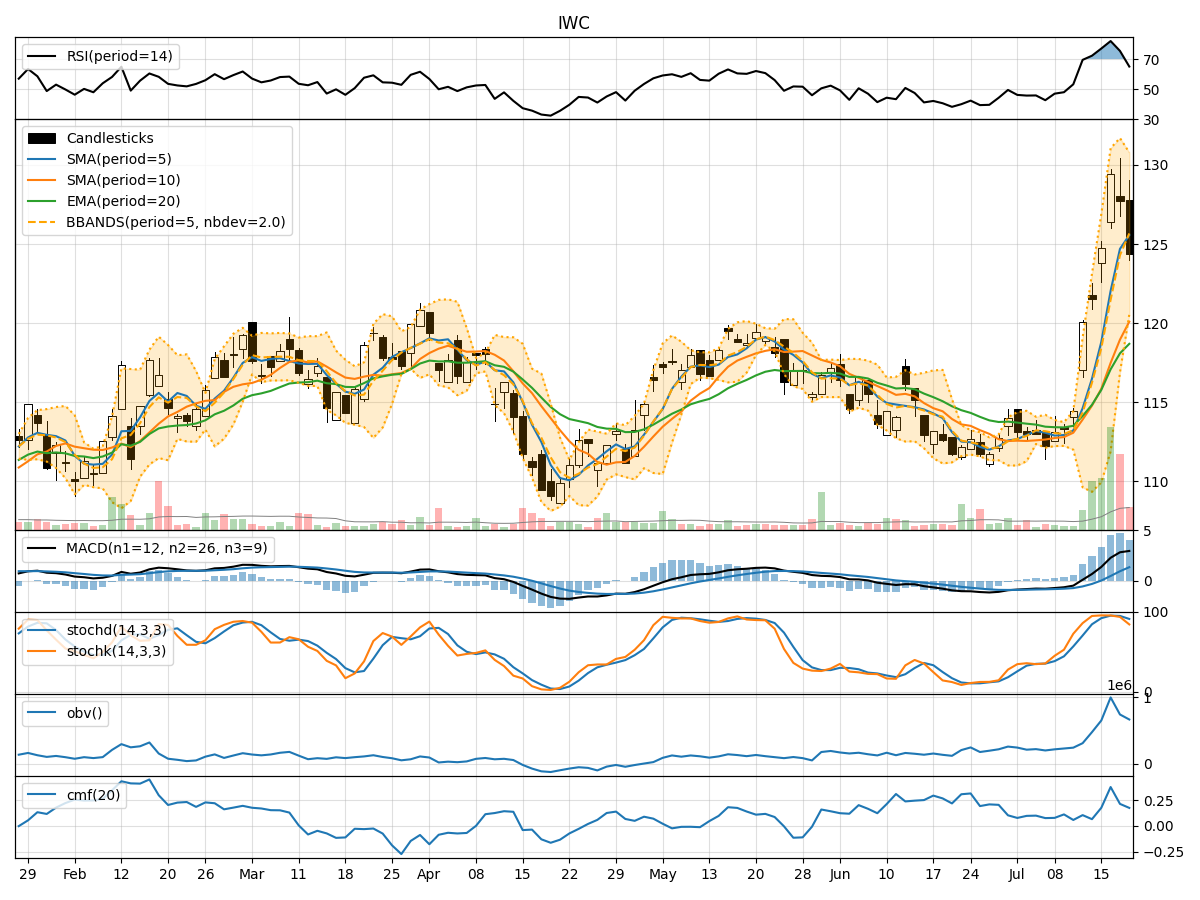
In analyzing the technical indicators for IWC over the last 5 days, we will delve into the trend, momentum, volatility, and volume indicators to provide a comprehensive outlook on the possible stock price movement. By examining these key aspects, we aim to offer valuable insights and predictions for the upcoming trading days.
Trend Analysis:
- Moving Averages (MA): The 5-day Moving Average (MA) has been consistently above the Simple Moving Average (SMA) and Exponential Moving Average (EMA), indicating a bullish trend.
- MACD: The MACD line has been positive, with the MACD Histogram showing an increasing trend, suggesting bullish momentum.
Momentum Analysis:
- RSI: The Relative Strength Index (RSI) has been fluctuating around the neutral zone, indicating indecision in the market.
- Stochastic Oscillator: Both %K and %D have been declining, signaling a potential bearish momentum.
Volatility Analysis:
- Bollinger Bands (BB): The stock price has been trading within the Bollinger Bands, with the bands narrowing, suggesting a period of consolidation.
Volume Analysis:
- On-Balance Volume (OBV): The OBV has shown mixed signals, indicating uncertainty in the buying and selling pressure.
- Chaikin Money Flow (CMF): The CMF has been negative, reflecting a lack of strong buying interest.
Key Observations:
- The trend indicators suggest a bullish sentiment, supported by the moving averages and MACD.
- Momentum indicators show a mixed picture, with RSI indicating neutrality and Stochastic Oscillator hinting at a potential bearish reversal.
- Volatility indicators point towards a period of consolidation, as the Bollinger Bands tighten.
- Volume indicators reflect uncertainty in market participation, with OBV and CMF showing conflicting signals.
Conclusion:
Based on the analysis of the technical indicators, the next few days' possible stock price movement for IWC could be sideways with a slight bearish bias. The bullish trend indicated by moving averages and MACD may face resistance due to the mixed momentum signals and lack of strong buying interest reflected in volume indicators. The narrowing Bollinger Bands suggest a period of consolidation, potentially leading to a sideways movement in the stock price. Traders should exercise caution and closely monitor key support and resistance levels for potential entry or exit points.
Recommendation:
Considering the current market dynamics, it is advisable to wait for further confirmation of a clear trend direction before making significant trading decisions. Traders may consider implementing risk management strategies to navigate the potential volatility and uncertainty in the market. Additionally, keeping a close watch on key technical levels and market developments will be crucial in adapting to any sudden shifts in the stock price movement.