Technical Analysis of IWDL 2024-05-10
Overview:
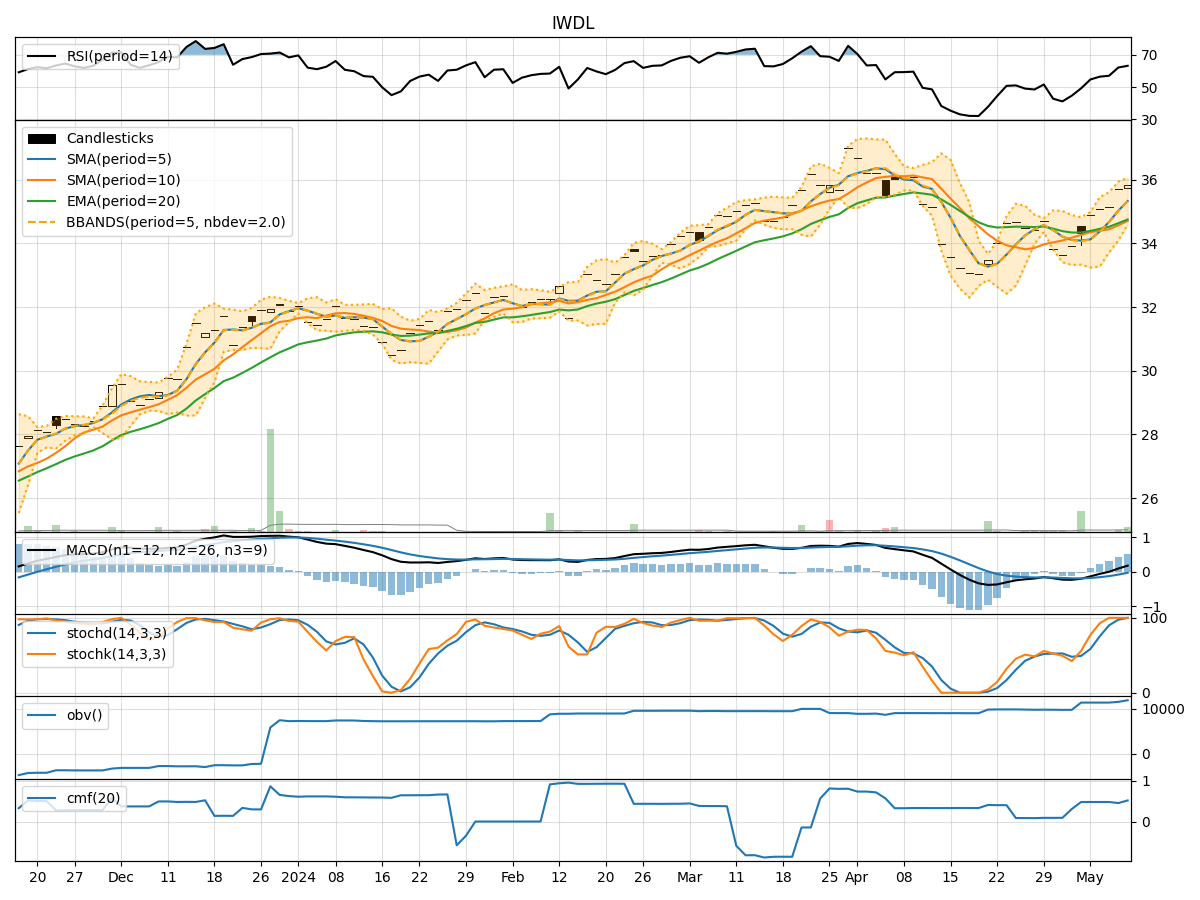
In the last 5 trading days, IWDL stock has shown a consistent uptrend in both price and volume. The moving averages have been trending upwards, indicating a bullish sentiment. Momentum indicators like RSI and Stochastic oscillators are in overbought territory, suggesting a potential pullback. Volatility indicators show a narrowing of Bollinger Bands, indicating a decrease in price volatility. Volume indicators like OBV and CMF have been steadily increasing, supporting the bullish trend.
Trend Analysis:
- Moving Averages (MA): The 5-day MA has been consistently above the 10-day SMA and 20-day EMA, indicating a strong bullish trend.
- MACD: The MACD line has been above the signal line, showing positive momentum in the stock price.
- MACD Histogram: The MACD histogram has been increasing, indicating strengthening bullish momentum.
Momentum Analysis:
- RSI: The RSI is in overbought territory, suggesting that the stock may be due for a pullback.
- Stochastic Oscillators: Both %K and %D are at 100%, indicating an overbought condition.
- Williams %R: The Williams %R is at 0, also signaling an overbought condition.
Volatility Analysis:
- Bollinger Bands: The Bollinger Bands are narrowing, indicating a decrease in price volatility.
- Bollinger %B: The %B is below 1, suggesting that the stock price is trading below the upper Bollinger Band.
Volume Analysis:
- On-Balance Volume (OBV): The OBV has been steadily increasing, showing accumulation by investors.
- Chaikin Money Flow (CMF): The CMF is positive, indicating buying pressure in the stock.
Key Observations:
- The stock is in a strong uptrend based on moving averages and MACD.
- Momentum indicators suggest the stock is overbought and may experience a pullback.
- Volatility is decreasing, indicating a potential period of consolidation.
- Volume indicators support the bullish trend with increasing OBV and positive CMF.
Conclusion:
Based on the technical analysis of IWDL stock: - Short-Term: The stock may experience a pullback in the next few days due to overbought conditions indicated by momentum indicators. - Medium-Term: The overall trend remains bullish, but a period of consolidation or sideways movement is likely as volatility decreases. - Long-Term: The bullish trend is expected to continue, supported by increasing volume indicators.
Recommendation:
- Short-Term Traders: Consider taking profits or waiting for a pullback before entering new positions.
- Long-Term Investors: Hold onto existing positions and consider accumulating on any dips for potential long-term gains.
Disclaimer:
This analysis is based solely on technical indicators and historical data. Market conditions can change rapidly, and it is essential to consider other factors before making investment decisions. Consult with a financial advisor for personalized advice tailored to your risk tolerance and investment goals.