Technical Analysis of IWF 2024-05-10
Overview:
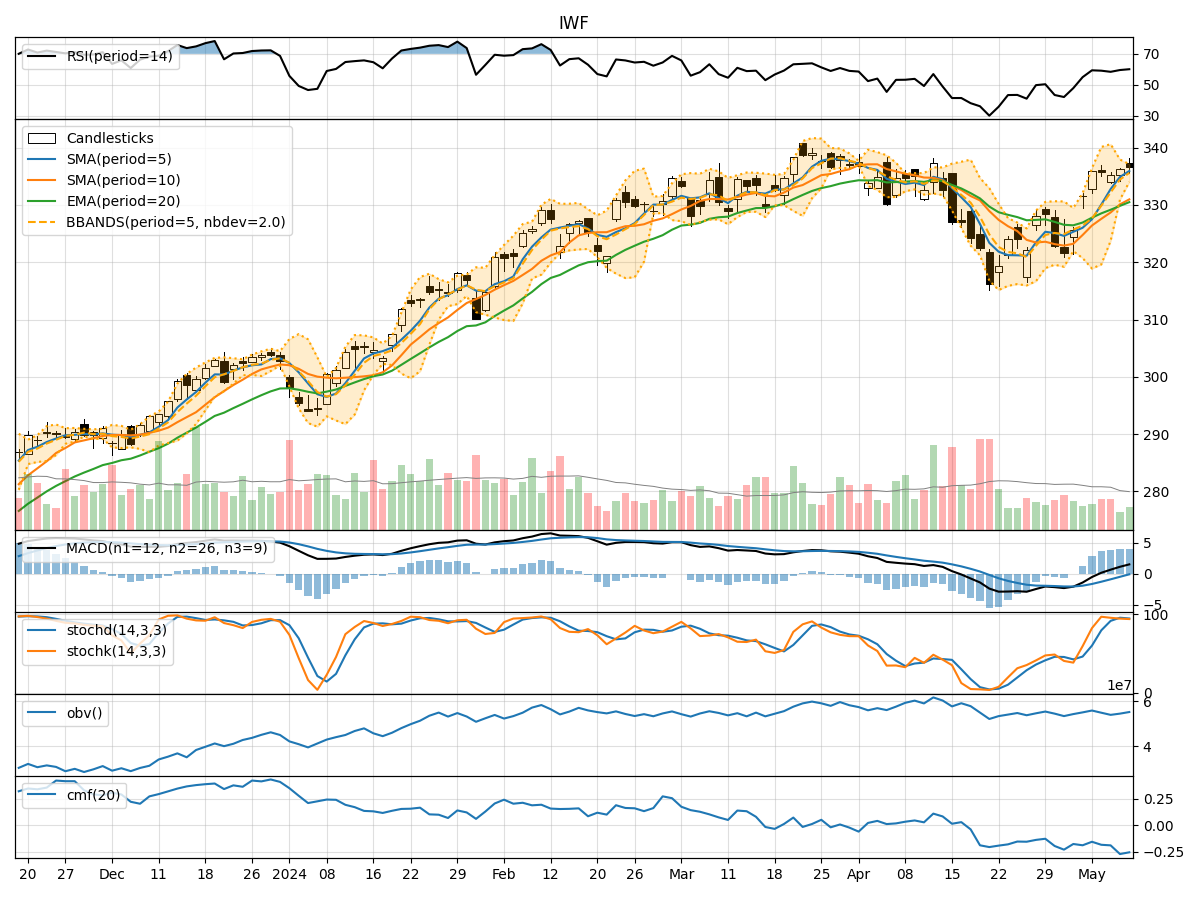
In analyzing the technical indicators for IWF over the last 5 days, we will delve into the trend, momentum, volatility, and volume indicators to provide a comprehensive outlook on the possible stock price movement in the coming days. By examining these key indicators, we aim to offer valuable insights and predictions for informed decision-making.
Trend Indicators:
- Moving Averages (MA): The 5-day moving average has been consistently above the longer-term simple moving average (SMA) and exponential moving average (EMA), indicating a bullish trend.
- MACD: The MACD line has been consistently above the signal line, with both lines trending upwards, suggesting bullish momentum.
- Conclusion: The trend indicators point towards an upward trend in the stock price.
Momentum Indicators:
- RSI: The Relative Strength Index (RSI) has been hovering around the 60-70 range, indicating a balanced momentum.
- Stochastic Oscillator: Both %K and %D have been in the overbought territory, suggesting potential for a pullback.
- Conclusion: Momentum indicators suggest a neutral stance with a slight potential for a bearish correction.
Volatility Indicators:
- Bollinger Bands: The stock price has been trading within the bands, with the bands narrowing, indicating decreasing volatility.
- Conclusion: Volatility indicators signal a sideways movement with a potential for a breakout in either direction.
Volume Indicators:
- On-Balance Volume (OBV): The OBV has shown mixed signals, with fluctuations in volume but no clear trend.
- Chaikin Money Flow (CMF): The CMF has been negative, indicating selling pressure.
- Conclusion: Volume indicators suggest a lack of strong conviction in the market, with a bearish bias.
Conclusion:
Based on the analysis of trend, momentum, volatility, and volume indicators, the overall outlook for IWF in the next few days is as follows: - Trend: Upward - Momentum: Neutral with a potential for a bearish correction - Volatility: Sideways with a potential for a breakout - Volume: Lack of strong conviction with a bearish bias
Final Recommendation:
Considering the mixed signals from the technical indicators, investors should exercise caution and closely monitor the stock price movement. It is advisable to wait for more clarity in market direction before making significant trading decisions. Stay vigilant for potential reversals or breakouts and consider implementing appropriate risk management strategies.