Technical Analysis of IWFG 2024-05-10
Overview:
In analyzing the technical indicators for IWFG over the last 5 days, we will delve into the trend, momentum, volatility, and volume indicators to provide a comprehensive outlook on the possible stock price movement in the coming days. By examining these key aspects, we aim to offer valuable insights and predictions to guide your investment decisions.
Trend Indicators:
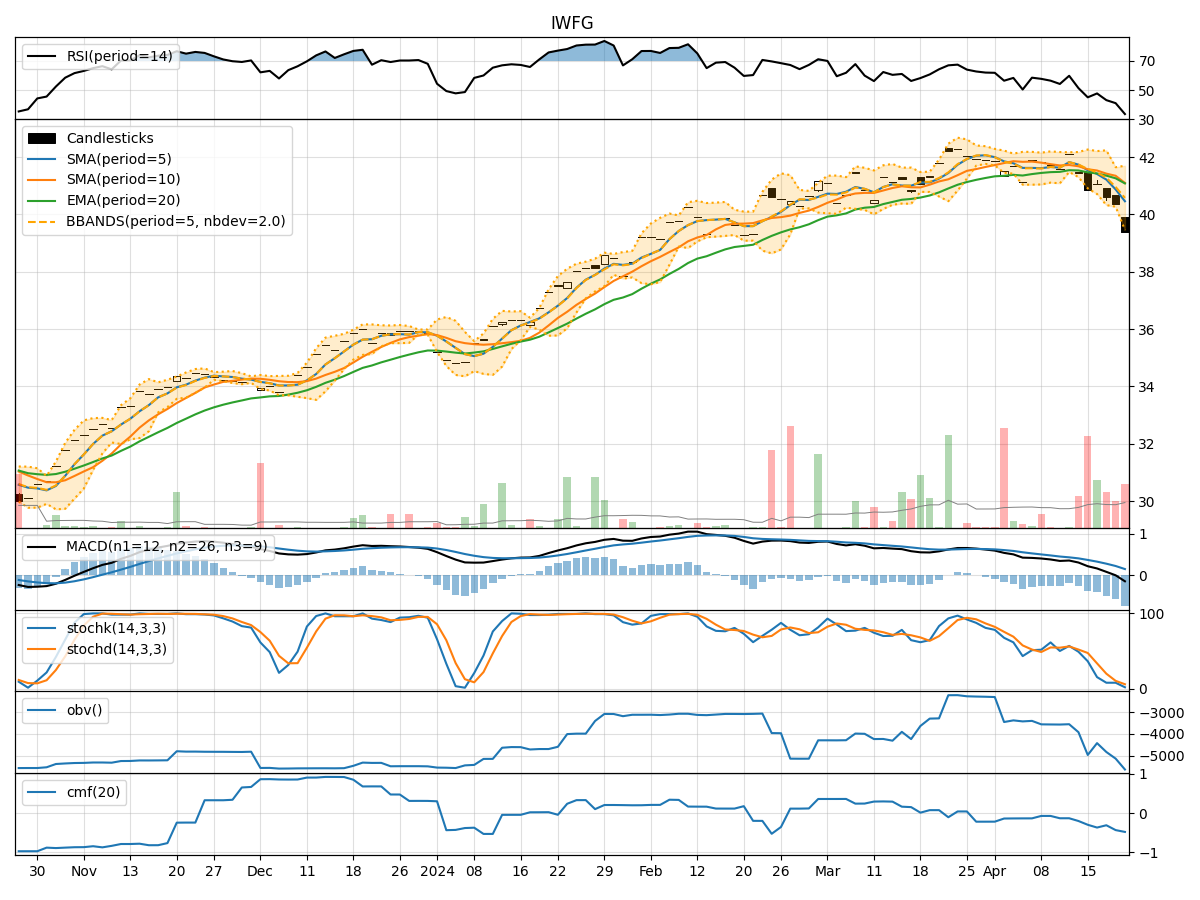
- Moving Averages (MA): The 5-day MA has been consistently above the 10-day SMA, indicating a short-term bullish trend. The EMA(20) has shown a gradual uptrend, reflecting positive momentum in the stock price.
- MACD: The MACD line has been above the signal line for the past 5 days, suggesting bullish momentum. The MACD histogram has been steadily increasing, indicating strengthening bullish momentum.
Momentum Indicators:
- RSI: The RSI has been trending upwards and is currently in the overbought territory, suggesting a strong bullish momentum in the stock.
- Stochastic Oscillator: Both %K and %D have been at 100%, indicating a strong bullish momentum with potential for further upside movement.
Volatility Indicators:
- Bollinger Bands (BB): The stock price has been trading close to the upper Bollinger Band, indicating high volatility and potential overbought conditions.
- Bollinger %B: The %B value has been consistently above 0.8, indicating a potential overbought situation.
Volume Indicators:
- On-Balance Volume (OBV): The OBV has been slightly decreasing over the past 5 days, suggesting some distribution happening in the stock.
- Chaikin Money Flow (CMF): The CMF(20) has been negative, indicating a bearish money flow in the stock.
Key Observations:
- The trend indicators suggest a strong bullish sentiment with the moving averages and MACD signaling an upward trend.
- Momentum indicators like RSI and Stochastic Oscillator indicate a highly overbought condition, potentially leading to a short-term correction.
- Volatility indicators point towards high volatility and a potential overbought scenario, which could result in a price pullback.
- Volume indicators show a slight decrease in buying pressure, indicating a possible weakening of the bullish trend.
Conclusion:
Based on the analysis of the technical indicators, the stock price of IWFG is likely to experience a short-term correction or consolidation in the coming days. The overbought conditions highlighted by momentum and volatility indicators suggest a potential pullback in the stock price. Traders may consider taking profits or waiting for a better entry point before considering long positions. Exercise caution in the current market environment to manage risks effectively.