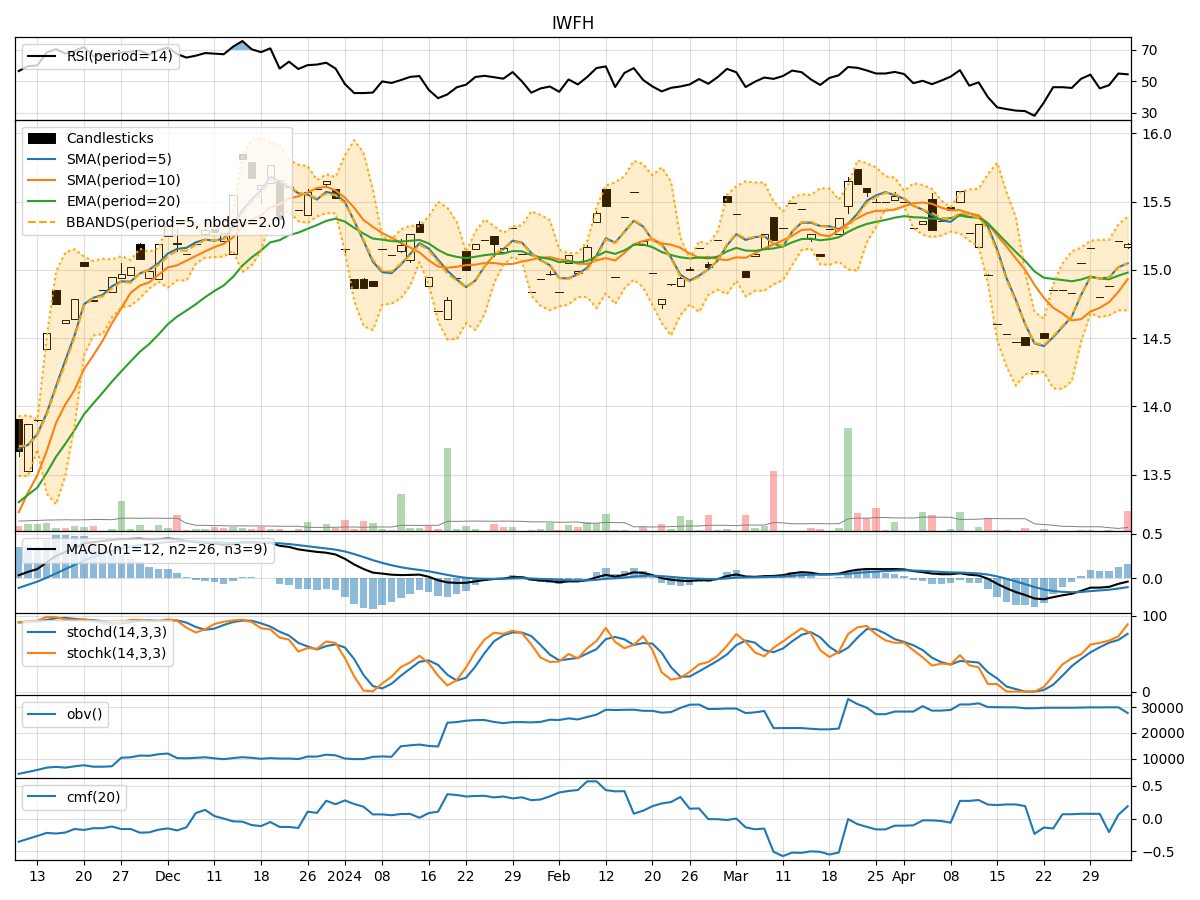
Technical Analysis of IWFH 2024-05-10
Overview:
In analyzing the technical indicators for IWFH over the last 5 days, we will delve into the trend, momentum, volatility, and volume indicators to provide a comprehensive outlook on the possible stock price movement in the coming days.
Trend Indicators:
- Moving Averages (MA): The 5-day MA has been consistently above the closing price, indicating a short-term uptrend.
- MACD: The MACD line has been above the signal line, suggesting bullish momentum.
- RSI: The RSI has been fluctuating around the 50 level, indicating indecision in the market.
Momentum Indicators:
- Stochastic Oscillator: The stochastic indicators have been gradually decreasing, signaling a potential reversal in momentum.
- Williams %R: The Williams %R has been in oversold territory, indicating a possible buying opportunity.
Volatility Indicators:
- Bollinger Bands: The stock price has been trading within the Bollinger Bands, suggesting a period of consolidation.
- Volatility: Volatility has been relatively low, indicating a lack of significant price movements.
Volume Indicators:
- On-Balance Volume (OBV): The OBV has been fluctuating, indicating mixed buying and selling pressure.
- Chaikin Money Flow (CMF): The CMF has been negative, suggesting outflow of money from the stock.
Key Observations:
- The trend indicators show a bullish bias in the short term.
- Momentum indicators suggest a potential reversal in momentum.
- Volatility indicators point towards a period of consolidation.
- Volume indicators reflect mixed buying and selling pressure.
Conclusion:
Based on the analysis of the technical indicators, the next few days for IWFH could see sideways movement with a slight upward bias. Traders may consider cautious buying opportunities as the stock consolidates within a range. However, it is essential to monitor the stochastic indicators for a potential shift in momentum. Exercise caution and consider setting appropriate stop-loss levels to manage risk effectively.