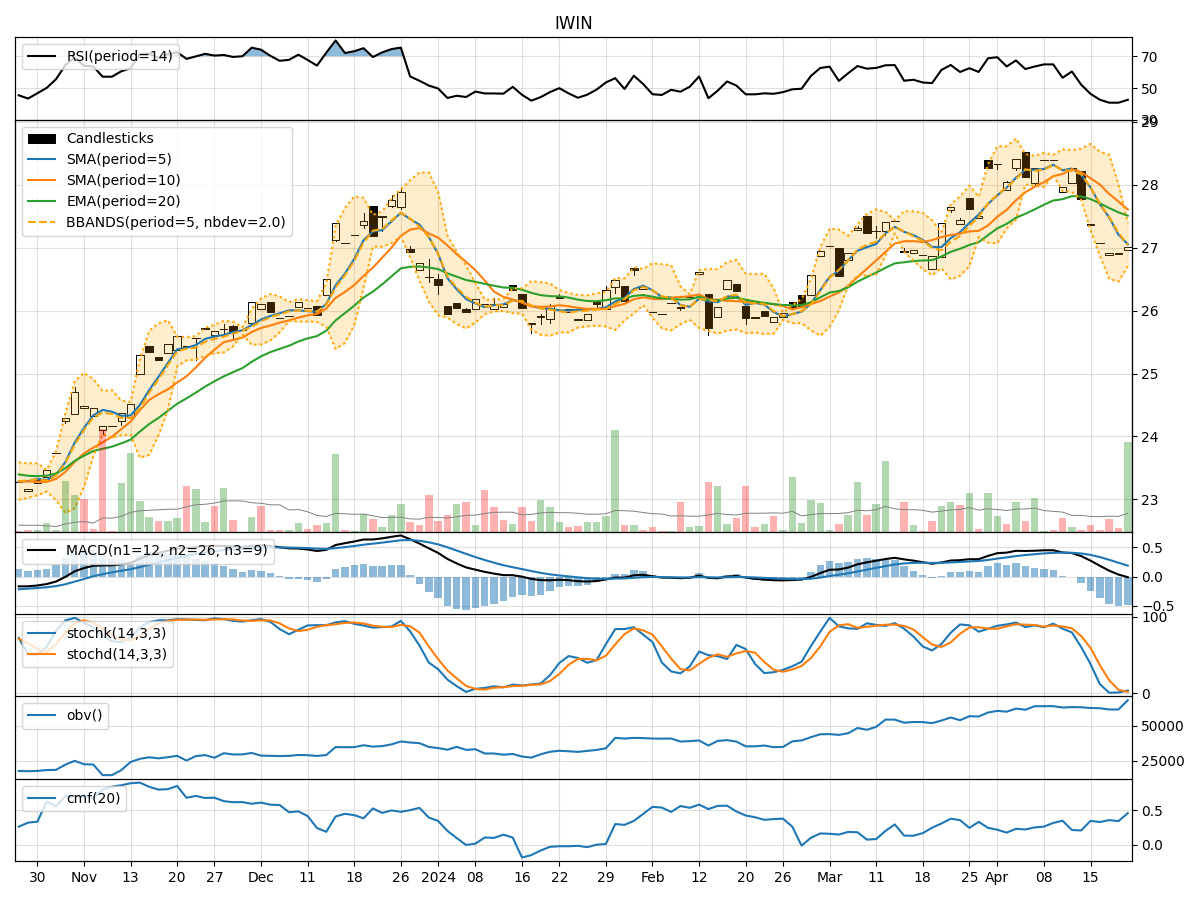
Technical Analysis of IWIN 2024-05-10
Overview:
In analyzing the technical indicators for IWIN stock over the last 5 days, we will delve into the trends, momentum, volatility, and volume aspects to provide a comprehensive outlook on the possible stock price movement in the coming days. By examining key indicators such as moving averages, MACD, RSI, Bollinger Bands, and OBV, we aim to offer valuable insights and predictions for potential price action.
Trend Analysis:
- Moving Averages (MA): The 5-day MA has been consistently above the closing prices, indicating a short-term uptrend.
- MACD: The MACD line has been above the signal line, suggesting bullish momentum.
- EMA: The EMA has been trending upwards, supporting the bullish sentiment.
Momentum Analysis:
- RSI: The RSI has been fluctuating around the overbought territory, indicating strong buying pressure.
- Stochastic Oscillator: Both %K and %D have been relatively high, signaling potential overbought conditions.
- Williams %R: The indicator has been hovering near oversold levels, suggesting a possible reversal.
Volatility Analysis:
- Bollinger Bands: The stock price has mostly stayed within the bands, with recent narrowing indicating reduced volatility.
- Bollinger %B: The %B indicator has been fluctuating around the midline, reflecting consolidation.
Volume Analysis:
- On-Balance Volume (OBV): The OBV has shown a slight increase, indicating accumulation by investors.
- Chaikin Money Flow (CMF): The CMF has been positive, suggesting buying pressure in the stock.
Key Observations:
- The stock is currently in an upward trend based on moving averages and MACD.
- Momentum indicators like RSI and Stochastic Oscillator suggest overbought conditions.
- Volatility has been decreasing, indicating potential consolidation.
- Volume indicators show positive accumulation and buying pressure.
Conclusion:
Based on the analysis of technical indicators, the next few days for IWIN stock are likely to see further upside potential in the price. However, given the overbought signals from momentum indicators, there might be a short-term correction or consolidation before the uptrend resumes. Traders should closely monitor key support and resistance levels to capitalize on potential opportunities.