Technical Analysis of IWL 2024-05-10
Overview:
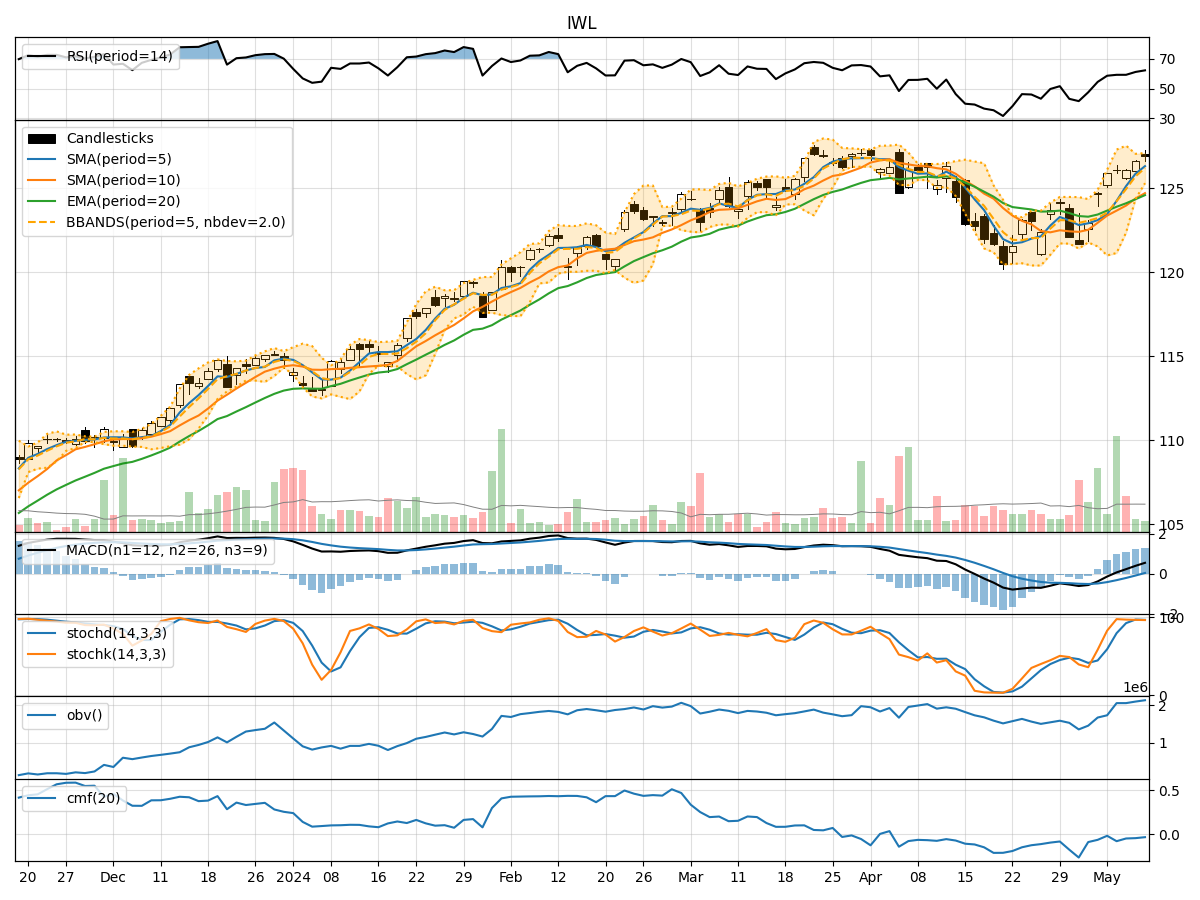
In the last 5 trading days, IWL stock has shown a consistent uptrend in its price movement, supported by positive momentum and relatively stable volatility. The volume has also been increasing, indicating growing interest from market participants.
Trend Analysis:
- Moving Averages (MA): The 5-day MA has been consistently above the 10-day SMA, indicating a short-term bullish trend. The EMA(20) has also been trending upwards, supporting the bullish sentiment.
- MACD: The MACD line has been consistently above the signal line, with both lines showing an upward trend. This suggests strong bullish momentum in the stock.
Key Observation: The trend indicators suggest a strong bullish trend in the stock price.
Momentum Analysis:
- RSI: The RSI has been gradually increasing and is currently in the overbought territory, indicating strong buying momentum.
- Stochastic Oscillator: Both %K and %D lines of the Stochastic Oscillator have been consistently high, suggesting strong upward momentum.
- Williams %R: The Williams %R is in the oversold region, indicating a potential reversal in the short term.
Key Observation: Momentum indicators signal a continuation of the bullish momentum in the stock.
Volatility Analysis:
- Bollinger Bands (BB): The stock price has been trading within the upper Bollinger Band, indicating an overbought condition. However, the bands are relatively narrow, suggesting a period of low volatility.
Key Observation: Volatility indicators suggest a potential consolidation or sideways movement in the stock price.
Volume Analysis:
- On-Balance Volume (OBV): The OBV has been steadily increasing, indicating strong buying pressure in the stock.
- Chaikin Money Flow (CMF): The CMF has been negative but improving, suggesting a potential influx of money into the stock.
Key Observation: Volume indicators support the bullish trend in the stock.
Conclusion:
Based on the analysis of the technical indicators, the stock of IWL is strongly bullish in the short term. The trend indicators, momentum indicators, and volume indicators all point towards a continuation of the upward trend. However, the volatility indicators suggest a possible consolidation or sideways movement in the near future due to the overbought condition.
Therefore, the next few days are likely to see a continuation of the upward trend with potential consolidation or sideways movement as the stock price adjusts to the overbought condition. Investors should consider taking profits or implementing risk management strategies to navigate the potential volatility ahead.