Technical Analysis of IWML 2024-05-10
Overview:
In analyzing the technical indicators for IWML over the last 5 days, we will delve into the trend, momentum, volatility, and volume indicators to provide a comprehensive outlook on the possible stock price movement in the coming days. By examining these key aspects, we aim to offer valuable insights and predictions for informed decision-making.
Trend Analysis:
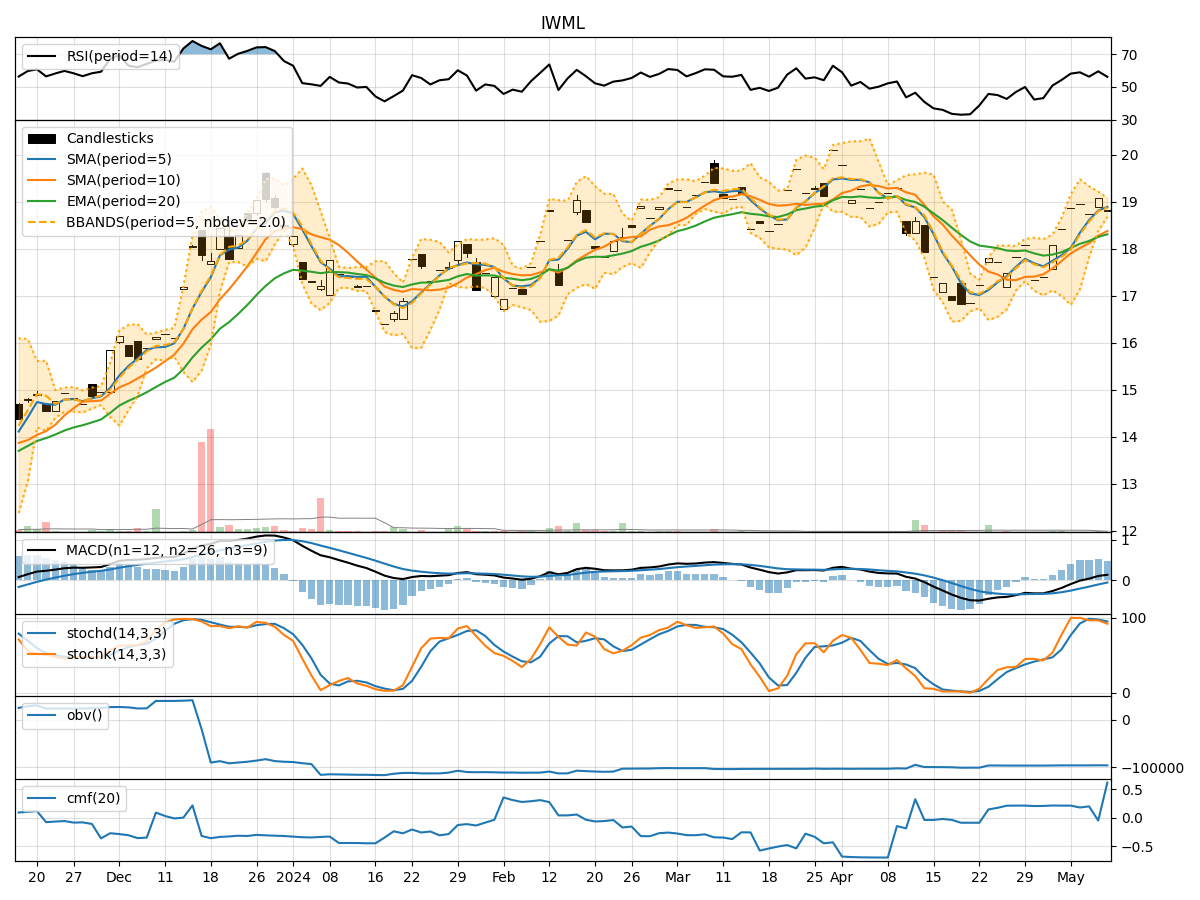
- Moving Averages (MA): The 5-day MA has been consistently above the closing prices, indicating a bullish trend.
- MACD: The MACD line has been above the signal line, suggesting a positive momentum in the stock price.
- EMA: The EMA has been trending upwards, reflecting a bullish sentiment in the market.
Momentum Analysis:
- RSI: The RSI has been fluctuating around the 50 level, indicating a neutral momentum.
- Stochastic Oscillator: Both %K and %D have been declining, signaling a potential reversal in momentum.
- Williams %R: The indicator has been in oversold territory, suggesting a possible bullish reversal.
Volatility Analysis:
- Bollinger Bands (BB): The stock price has been trading within the bands, indicating a period of consolidation.
- BB Width: The narrowing of the bands suggests decreasing volatility in the stock.
Volume Analysis:
- On-Balance Volume (OBV): The OBV has been relatively stable, indicating a balance between buying and selling pressure.
- Chaikin Money Flow (CMF): The CMF has been positive, suggesting a bullish money flow into the stock.
Key Observations:
- The trend indicators point towards a bullish sentiment in the stock price.
- Momentum indicators show a mixed signal with a potential for a bullish reversal.
- Volatility indicators suggest a period of consolidation and decreasing volatility.
- Volume indicators indicate a balanced buying and selling pressure with a bullish money flow.
Conclusion:
Based on the analysis of the technical indicators, the next few days' possible stock price movement for IWML is likely to be bullish. The trend is positive, supported by the MACD and EMA indicators. Although momentum indicators show some signs of weakness, the overall sentiment remains positive. The consolidation phase indicated by volatility indicators may lead to a breakout in the upward direction. The balanced volume with a bullish money flow further supports the upward bias in the stock price. Therefore, investors may consider buying IWML in the coming days for potential gains.