Technical Analysis of IWMW 2024-05-10
Overview:
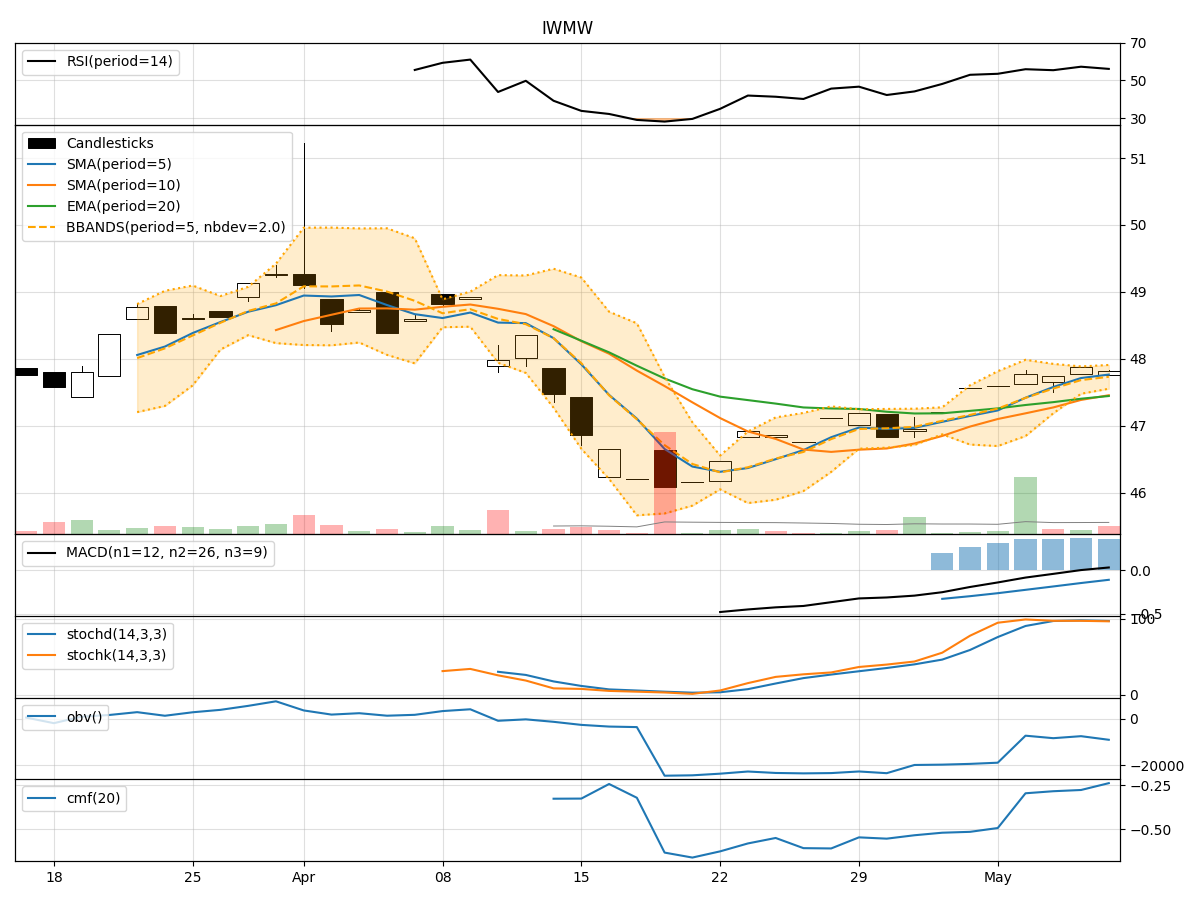
In analyzing the technical indicators for IWMW over the last 5 days, we will delve into the trend, momentum, volatility, and volume indicators to provide a comprehensive outlook on the possible stock price movement in the coming days. By examining these key aspects, we aim to offer valuable insights and predictions for potential investors.
Trend Analysis:
- Moving Averages (MA): The 5-day MA has been consistently above the closing prices, indicating a short-term uptrend.
- MACD: The MACD line has been negative but trending upwards, suggesting a potential reversal in the bearish momentum.
- RSI: The RSI values have been fluctuating around the neutral zone, reflecting indecision in the market sentiment.
Key Observation: The trend indicators show a mixed signal with a slight bullish bias.
Momentum Analysis:
- Stochastic Oscillator: Both %K and %D have been in overbought territory, signaling a potential reversal or consolidation.
- Williams %R: The indicator has been hovering in the oversold region, indicating a possible buying opportunity.
Key Observation: Momentum indicators suggest a potential reversal or consolidation in the near term.
Volatility Analysis:
- Bollinger Bands (BB): The bands have been narrowing, indicating decreasing volatility and a potential breakout.
- BB %B: The %B indicator has been fluctuating within a tight range, reflecting a period of consolidation.
Key Observation: Volatility indicators point towards a period of consolidation and a potential breakout.
Volume Analysis:
- On-Balance Volume (OBV): The OBV has been negative, suggesting selling pressure in the market.
- Chaikin Money Flow (CMF): The CMF has been consistently negative, indicating a lack of buying interest.
Key Observation: Volume indicators indicate a bearish sentiment prevailing in the market.
Conclusion:
Based on the analysis of the technical indicators, the stock price of IWMW is likely to experience further consolidation in the coming days. The trend indicators show a slight bullish bias, while momentum indicators suggest a potential reversal or consolidation. Volatility indicators point towards a breakout scenario, and volume indicators indicate a bearish sentiment.
Overall, the stock is expected to trade sideways with a slightly bullish bias in the short term. Traders should closely monitor key support and resistance levels for potential entry and exit points. It is advisable to wait for confirmation from multiple indicators before making any trading decisions.