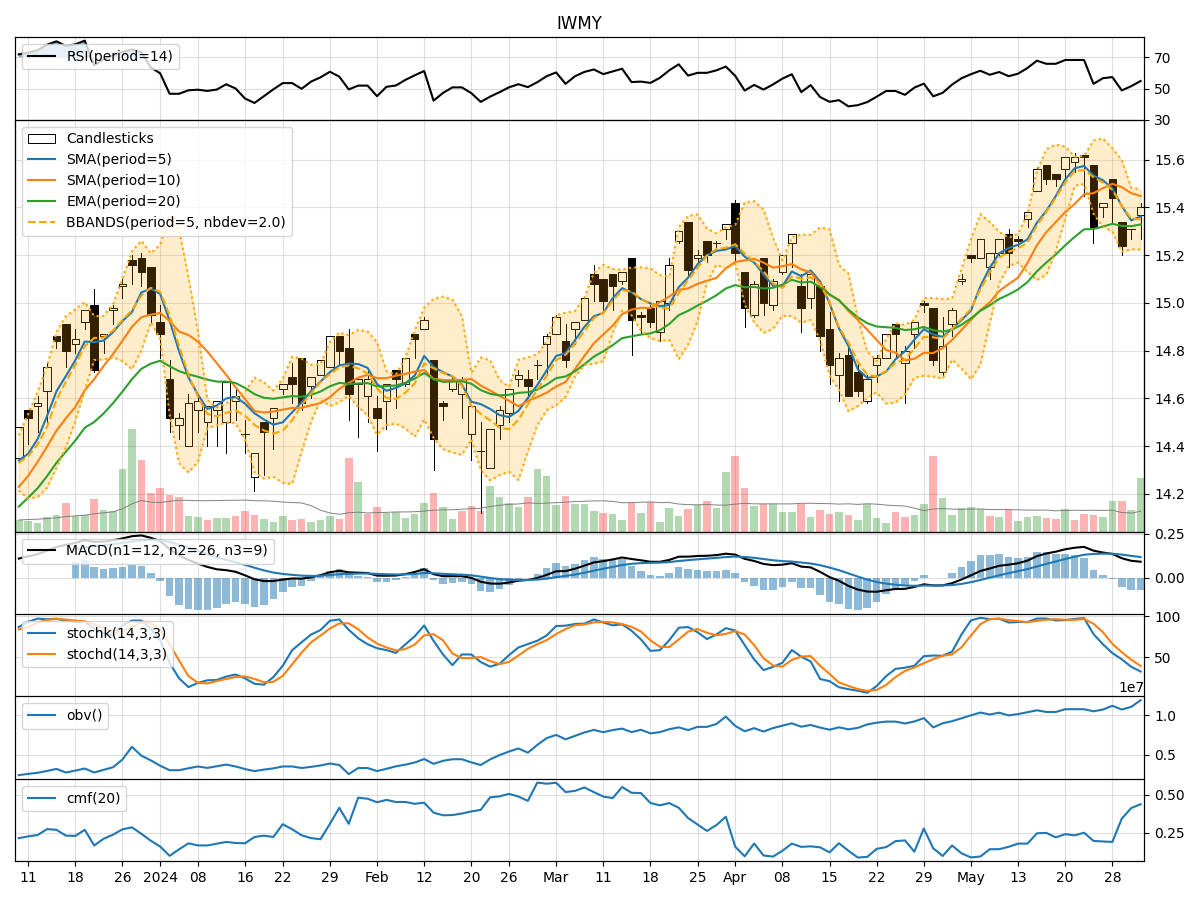
Technical Analysis of IWMY 2024-05-10
Overview:
In analyzing the technical indicators for IWMY over the last 5 days, we will delve into the trend, momentum, volatility, and volume indicators to provide a comprehensive outlook on the possible stock price movement in the coming days.
Trend Indicators:
- Moving Averages (MA): The 5-day MA has been consistently above the closing prices, indicating a short-term uptrend.
- MACD: The MACD line has been above the signal line, suggesting bullish momentum.
- EMA: The EMA has been trending upwards, supporting the bullish sentiment.
Key Observation: The trend indicators point towards a bullish outlook for IWMY.
Momentum Indicators:
- RSI: The RSI has been hovering around the 60 level, indicating moderate strength in the current uptrend.
- Stochastic Oscillator: Both %K and %D have been in the overbought zone, suggesting potential for a pullback.
- Williams %R: The indicator has been in the oversold territory, signaling a potential reversal.
Key Observation: Momentum indicators suggest a mixed sentiment with a slight bearish bias due to overbought conditions.
Volatility Indicators:
- Bollinger Bands: The price has been trading within the bands, indicating normal volatility.
- Bollinger %B: The %B is around 0.7, suggesting the price is closer to the upper band.
- Average True Range (ATR): The ATR has been relatively stable, indicating consistent volatility levels.
Key Observation: Volatility indicators imply a stable price movement with a slight bullish bias.
Volume Indicators:
- On-Balance Volume (OBV): The OBV has been fluctuating, indicating mixed buying and selling pressure.
- Chaikin Money Flow (CMF): The CMF has been positive, suggesting inflow of money into the stock.
Key Observation: Volume indicators reflect neutral sentiment with a slight bullish inclination.
Conclusion:
Based on the analysis of the technical indicators, the overall outlook for IWMY in the next few days is bullish with a potential for a short-term pullback due to overbought conditions in momentum indicators. The trend indicators strongly support a continuation of the current uptrend, while volatility and volume indicators suggest stability and positive money flow into the stock.
Key Conclusion: The stock is likely to experience upward movement in the coming days, with a possibility of a temporary correction before resuming the uptrend. Traders may consider buying on dips for potential gains.