Technical Analysis of IWO 2024-05-10
Overview:
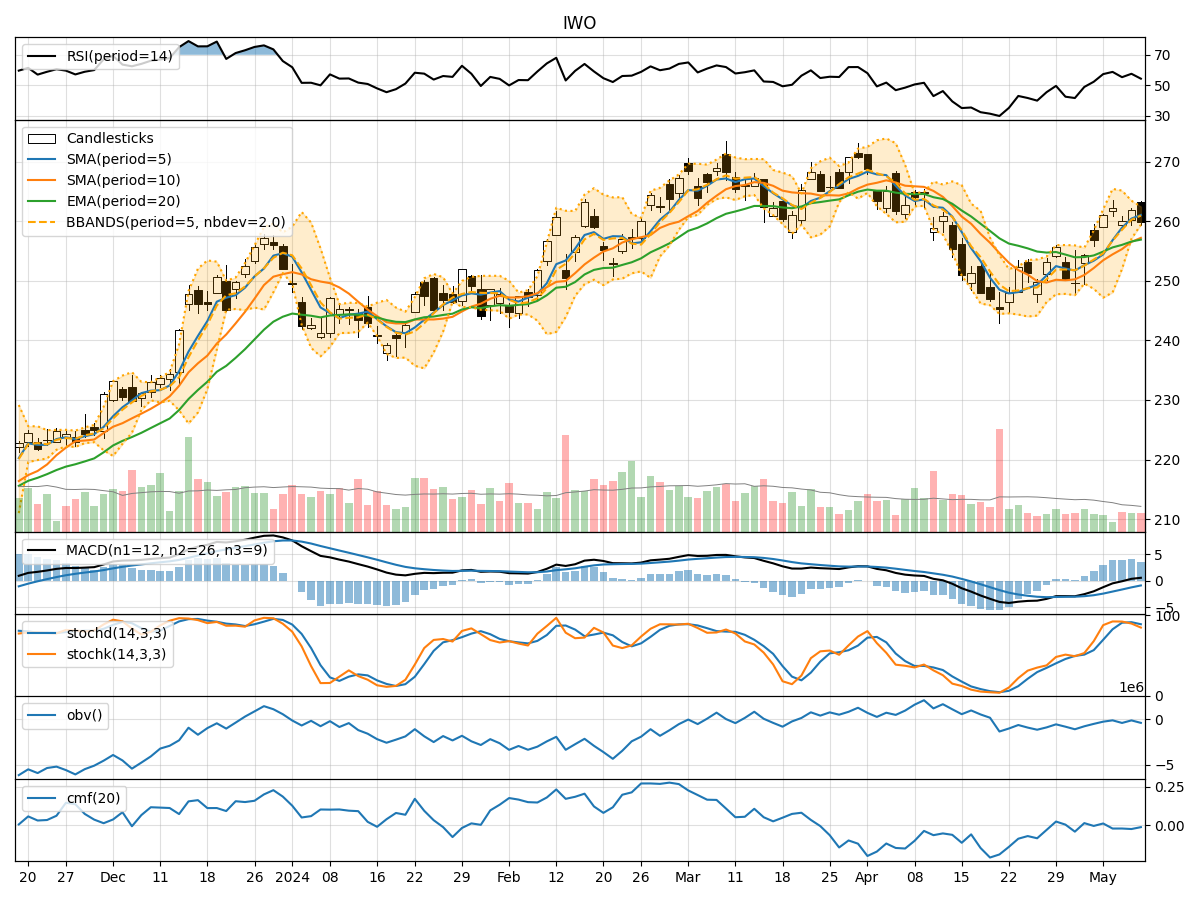
In analyzing the technical indicators for IWO over the last 5 days, we will delve into the trends, momentum, volatility, and volume indicators to provide a comprehensive outlook on the possible stock price movement in the coming days.
Trend Indicators:
- Moving Averages (MA): The 5-day Moving Average has been consistently above the Simple Moving Average (SMA) and Exponential Moving Average (EMA), indicating a bullish trend.
- MACD: The MACD line has been consistently above the signal line, suggesting a bullish momentum in the stock price.
- MACD Histogram: The MACD Histogram has been showing positive values, further supporting the bullish sentiment.
Momentum Indicators:
- RSI: The Relative Strength Index (RSI) has been fluctuating around the mid-level, indicating a neutral momentum.
- Stochastic Oscillator: Both %K and %D have been fluctuating, showing indecision in momentum.
- Williams %R: The Williams %R has been in oversold territory, suggesting a potential reversal in momentum.
Volatility Indicators:
- Bollinger Bands: The stock price has been trading within the Bollinger Bands, with the bands narrowing, indicating decreasing volatility.
- Bollinger %B: The %B indicator has been hovering around the mid-level, reflecting a neutral stance on volatility.
Volume Indicators:
- On-Balance Volume (OBV): The OBV has been fluctuating, indicating mixed sentiment among investors.
- Chaikin Money Flow (CMF): The CMF has been negative, suggesting outflow of money from the stock.
Key Observations:
- The trend indicators suggest a bullish sentiment in the stock price.
- Momentum indicators show mixed signals with a slight bias towards a potential reversal.
- Volatility indicators point towards decreasing volatility in the stock.
- Volume indicators reflect mixed sentiment among investors.
Conclusion:
Based on the analysis of the technical indicators, the stock price of IWO is likely to experience sideways movement in the coming days. The bullish trend indicated by moving averages and MACD may be offset by the neutral to bearish signals from momentum indicators like RSI and Stochastic Oscillator. The decreasing volatility and mixed volume sentiment further support the view of sideways movement. Investors should closely monitor key support and resistance levels for potential breakout opportunities.
Recommendation:
Given the current market dynamics, it is advisable to exercise caution and wait for clearer signals before making significant trading decisions. Traders may consider implementing range-bound strategies to capitalize on the anticipated sideways movement. Additionally, keeping a close eye on any developments that could potentially shift the market sentiment is crucial for making informed trading choices.