Technical Analysis of IWP 2024-05-10
Overview:
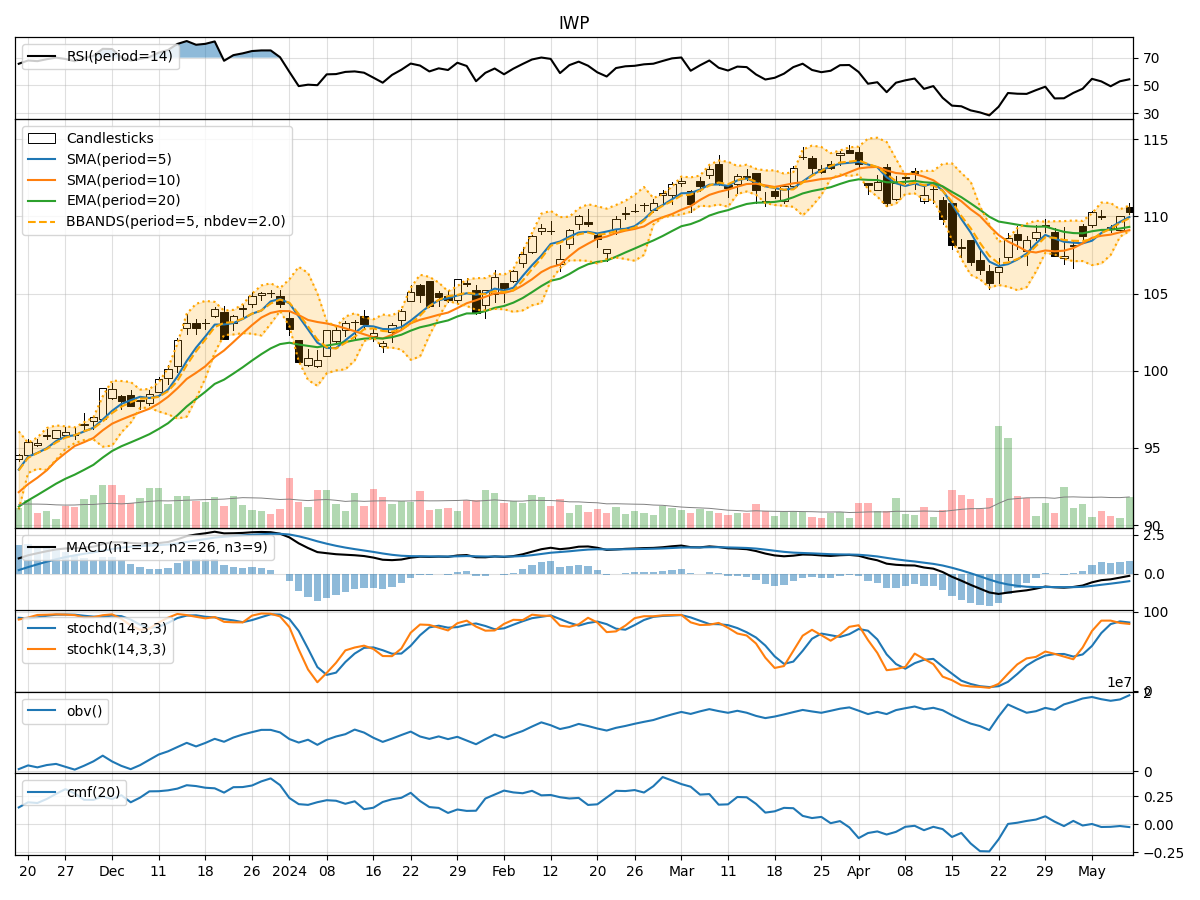
In the last 5 trading days, the stock price of IWP has shown some fluctuations but has generally maintained a relatively stable range. By analyzing various technical indicators such as trend, momentum, volatility, and volume, we can gain insights into the possible future price movement of IWP stock.
Trend Analysis:
- Moving Averages (MA): The 5-day Moving Average has been consistently above the 10-day Simple Moving Average, indicating a short-term bullish trend. The Exponential Moving Average (EMA) has also been trending upwards, supporting the bullish sentiment.
- MACD: The MACD line has been consistently above the signal line, suggesting a bullish momentum in the stock price.
- RSI: The Relative Strength Index (RSI) has been fluctuating around the 50 level, indicating a neutral sentiment in terms of momentum.
Momentum Analysis:
- Stochastic Oscillator: The Stochastic Oscillator has been hovering in the overbought territory, suggesting a potential reversal or consolidation in the near future.
- Williams %R: The Williams %R indicator has been fluctuating around the oversold region, indicating a mixed sentiment among traders.
Volatility Analysis:
- Bollinger Bands: The Bollinger Bands have been narrowing, indicating decreasing volatility in the stock price. This could potentially lead to a breakout or a significant price movement in the near future.
Volume Analysis:
- On-Balance Volume (OBV): The OBV indicator has been relatively stable, suggesting that the volume of trading has not shown significant divergence from the price movement.
- Chaikin Money Flow (CMF): The CMF has been negative, indicating that money flow has been slightly bearish in the short term.
Key Observations:
- The trend indicators suggest a bullish sentiment in the short term.
- Momentum indicators show a mixed sentiment with potential for a reversal.
- Volatility indicators point towards a potential breakout due to decreasing volatility.
- Volume indicators indicate a slightly bearish sentiment in the short term.
Conclusion:
Based on the analysis of the technical indicators, the next few days' possible stock price movement for IWP is likely to be sideways with a potential for a bullish breakout. Traders should closely monitor the Stochastic Oscillator for any signs of a reversal and the Bollinger Bands for a potential breakout. It is essential to consider both bullish and bearish scenarios and set appropriate stop-loss levels to manage risk effectively.