Technical Analysis of IWTR 2024-05-10
Overview:
In analyzing the technical indicators for IWTR over the last 5 days, we will delve into the trend, momentum, volatility, and volume indicators to provide a comprehensive outlook on the possible stock price movement in the coming days.
Trend Analysis:
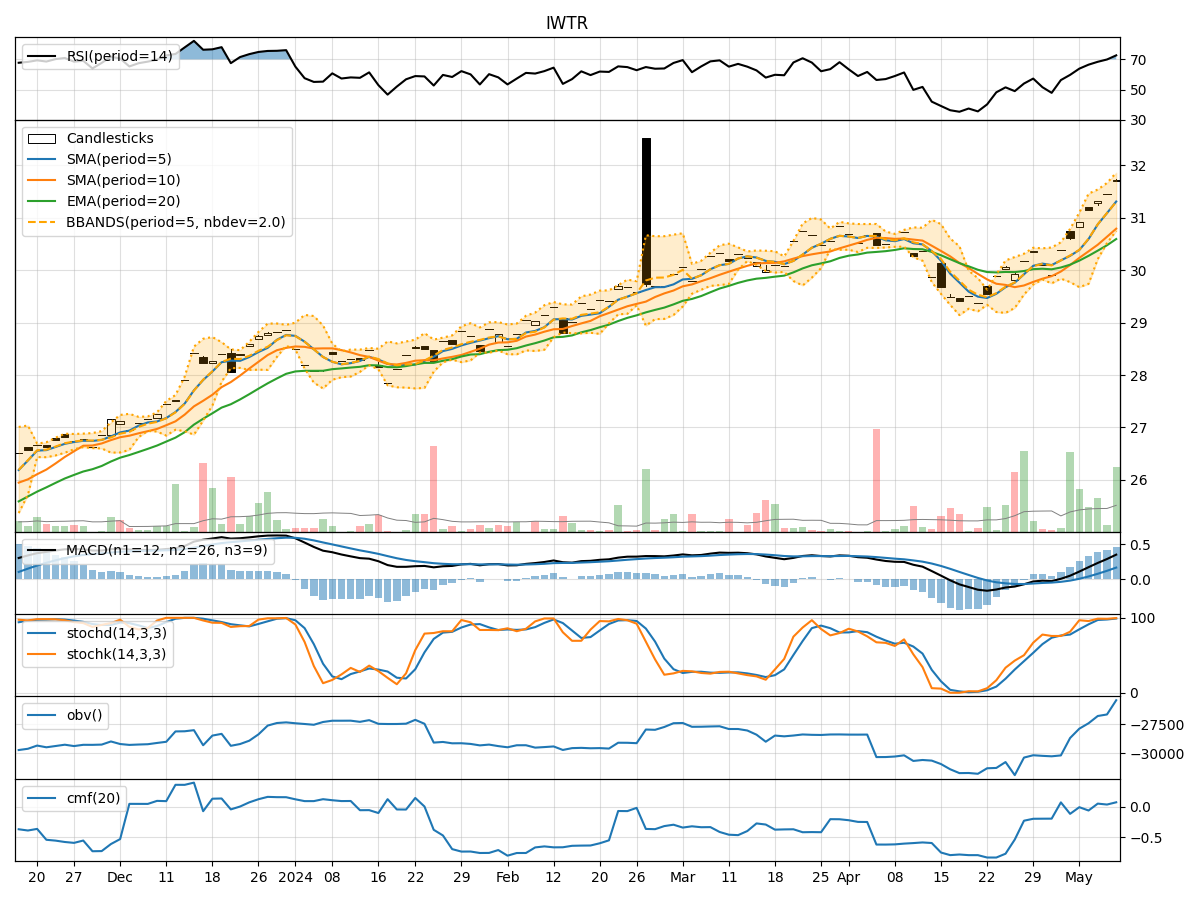
- Moving Averages (MA): The 5-day Moving Average (MA) has been consistently above the Simple Moving Average (SMA) and Exponential Moving Average (EMA), indicating a bullish trend.
- MACD: The MACD line has been above the signal line, with both lines showing an upward trend, suggesting bullish momentum.
Momentum Analysis:
- RSI: The Relative Strength Index (RSI) has been increasing and is currently in the overbought territory, indicating a strong bullish momentum.
- Stochastic Oscillator: Both %K and %D lines of the Stochastic Oscillator are in the overbought zone, signaling a potential reversal or consolidation.
Volatility Analysis:
- Bollinger Bands (BB): The stock price has been trading within the upper Bollinger Band, indicating an increased volatility and a potential overbought condition.
Volume Analysis:
- On-Balance Volume (OBV): The OBV has been increasing, suggesting that buying volume has been higher than selling volume.
- Chaikin Money Flow (CMF): The CMF is positive, indicating a bullish money flow into the stock.
Key Observations:
- The trend indicators suggest a strong bullish sentiment in the short term.
- Momentum indicators show an overbought condition, which might lead to a potential reversal or consolidation.
- Volatility is increasing, indicating a higher level of price fluctuation.
- Volume indicators support the bullish trend with increasing buying volume.
Conclusion:
Based on the analysis of the technical indicators, the next few days' possible stock price movement for IWTR is likely to continue in an upward direction in the short term. However, considering the overbought conditions in the momentum indicators and increased volatility, there might be a potential for a short-term consolidation or a minor pullback before resuming the uptrend. Traders should closely monitor the price action and key support levels for potential entry or exit points.
Recommendation:
- Short-term traders: Consider taking profits or tightening stop-loss levels to protect gains.
- Long-term investors: Hold positions but be prepared for short-term fluctuations.
- Entry/Exit Strategy: Look for opportunities to enter on pullbacks or consolidation phases for better risk management.
Always remember to combine technical analysis with fundamental research and risk management strategies for a well-rounded investment approach.