Technical Analysis of IWX 2024-05-10
Overview:
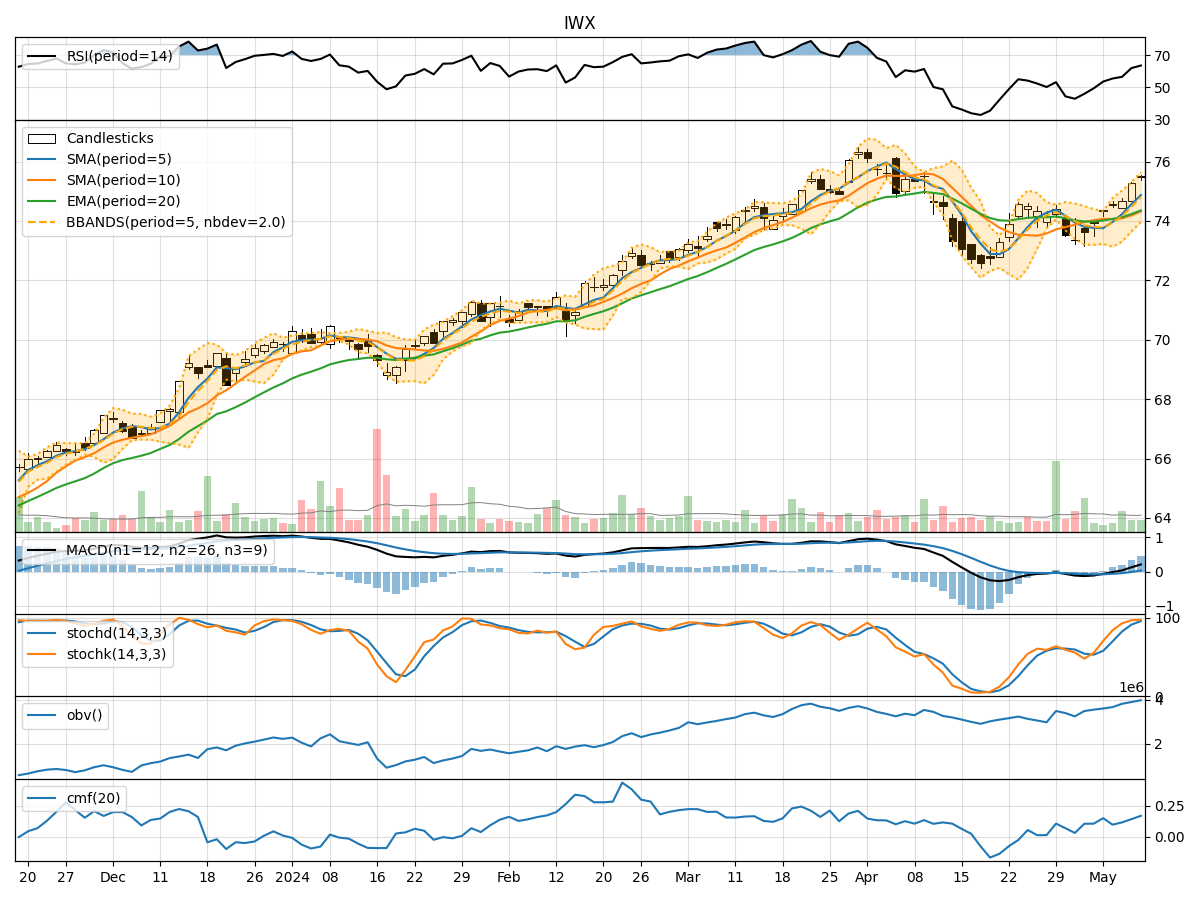
In analyzing the technical indicators for IWX over the last 5 days, we will delve into the trend, momentum, volatility, and volume indicators to provide a comprehensive outlook on the possible stock price movement in the coming days. By examining these key aspects, we aim to offer valuable insights and predictions for informed decision-making.
Trend Indicators:
- Moving Averages (MA): The 5-day MA has been trending upwards, indicating a positive momentum in the stock price.
- MACD: The MACD line has been consistently above the signal line, suggesting a bullish trend.
- RSI: The RSI has been increasing, reflecting strengthening buying pressure.
Momentum Indicators:
- Stochastic Oscillator: Both %K and %D have been in overbought territory, signaling a potential reversal or consolidation.
- Williams %R: The indicator has been hovering in oversold territory, indicating a possible buying opportunity.
Volatility Indicators:
- Bollinger Bands: The stock price has been trading within the bands, showing moderate volatility.
- BB%: The %B indicator has been fluctuating around the midline, indicating a balanced market sentiment.
Volume Indicators:
- On-Balance Volume (OBV): The OBV has been steadily increasing, suggesting accumulation by investors.
- Chaikin Money Flow (CMF): The CMF has been positive, indicating buying pressure in the stock.
Key Observations:
- The trend indicators suggest a bullish sentiment with the moving averages and MACD signaling upward momentum.
- Momentum indicators show mixed signals with stochastic oscillators hinting at a potential reversal while Williams %R indicates a buying opportunity.
- Volatility indicators point towards moderate price fluctuations within the Bollinger Bands.
- Volume indicators indicate increasing buying pressure and accumulation by investors.
Conclusion:
Based on the analysis of the technical indicators, the overall outlook for IWX in the next few days is bullish. The positive trend indicators, increasing buying pressure reflected in momentum and volume indicators, and moderate volatility suggest a potential upward movement in the stock price. Traders and investors may consider buying opportunities in anticipation of a continued uptrend. However, it is essential to monitor the stochastic oscillators for any signs of a reversal and adjust strategies accordingly.