Technical Analysis of IXP 2024-05-10
Overview:
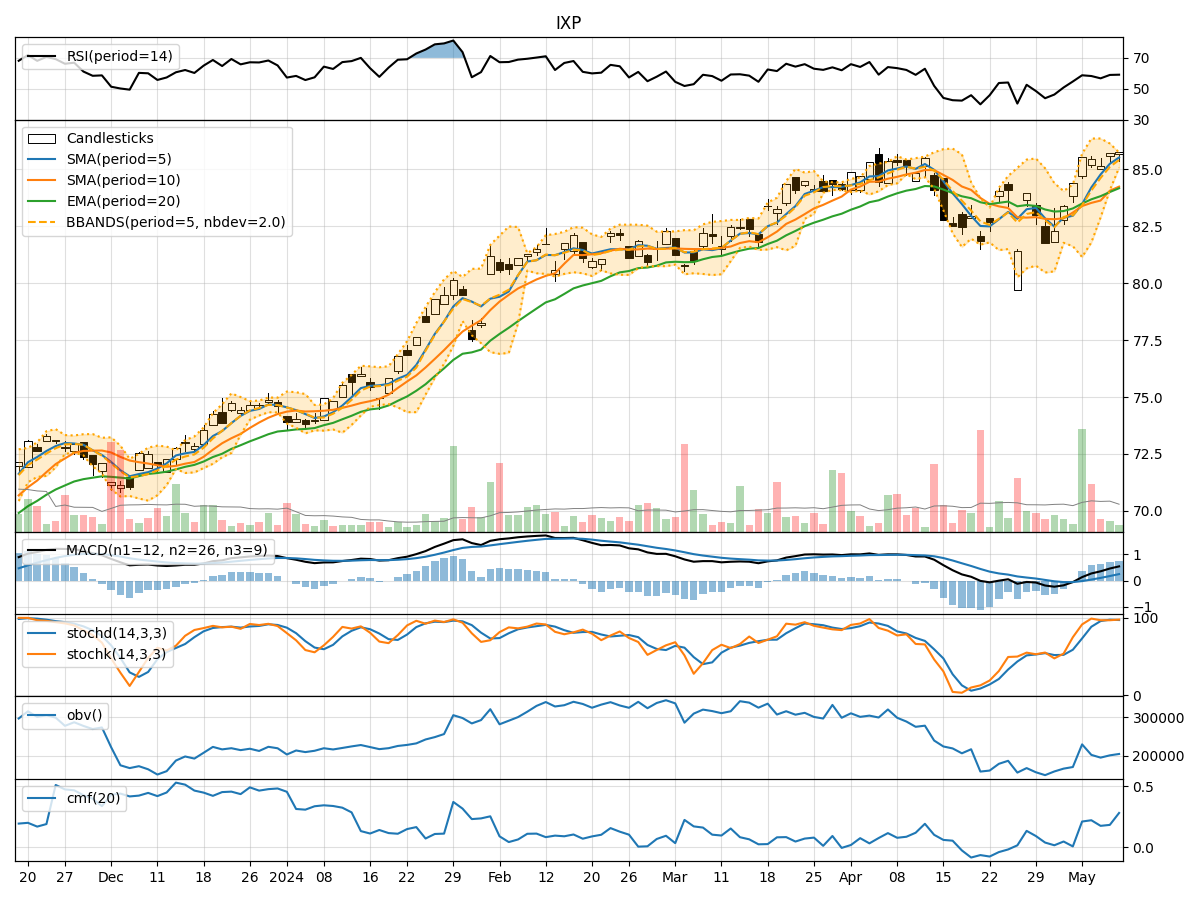
In analyzing the technical indicators for IXP over the last 5 days, we will delve into the trend, momentum, volatility, and volume indicators to provide a comprehensive outlook on the possible stock price movement in the coming days.
Trend Analysis:
- Moving Averages (MA): The 5-day Moving Average (MA) has been consistently rising, indicating a bullish trend.
- MACD: The MACD line has been above the signal line for the past few days, suggesting a bullish momentum.
- EMA: The Exponential Moving Average (EMA) has been trending upwards, supporting the bullish sentiment.
Momentum Analysis:
- RSI: The Relative Strength Index (RSI) has been in the neutral to slightly overbought territory, indicating a balanced momentum.
- Stochastic Oscillator: Both %K and %D have been in the overbought zone, suggesting a potential reversal or consolidation.
- Williams %R: The Williams %R is hovering around the oversold region, signaling a possible buying opportunity.
Volatility Analysis:
- Bollinger Bands (BB): The Bollinger Bands have been narrowing, indicating decreasing volatility and a potential breakout.
- BB %B: The %B indicator is relatively stable, suggesting a period of consolidation.
- BB Width: The Bollinger Bands Width is contracting, signaling a potential decrease in volatility.
Volume Analysis:
- On-Balance Volume (OBV): The OBV has been declining, indicating selling pressure in the market.
- Chaikin Money Flow (CMF): The CMF has been positive, suggesting buying pressure despite the declining OBV.
Conclusion:
Based on the analysis of the technical indicators, the next few days' possible stock price movement for IXP is likely to be sideways with a slight bearish bias. The trend indicators support a bullish outlook, but the momentum indicators show signs of potential reversal or consolidation. The volatility indicators point towards a period of reduced volatility, possibly leading to a sideways movement. The volume analysis indicates a mix of buying and selling pressure, which could result in a lack of clear direction in the stock price.
Recommendation:
Considering the overall technical picture, it is advisable to exercise caution in trading IXP in the coming days. Traders may consider implementing risk management strategies to navigate the potential sideways movement with a bearish bias. Monitoring key support and resistance levels along with keeping a close eye on any breakout from the Bollinger Bands can provide valuable insights for decision-making.
Remember, market dynamics can change rapidly, so staying informed and adapting to new developments is crucial for successful trading.