Technical Analysis of IYC 2024-05-10
Overview:
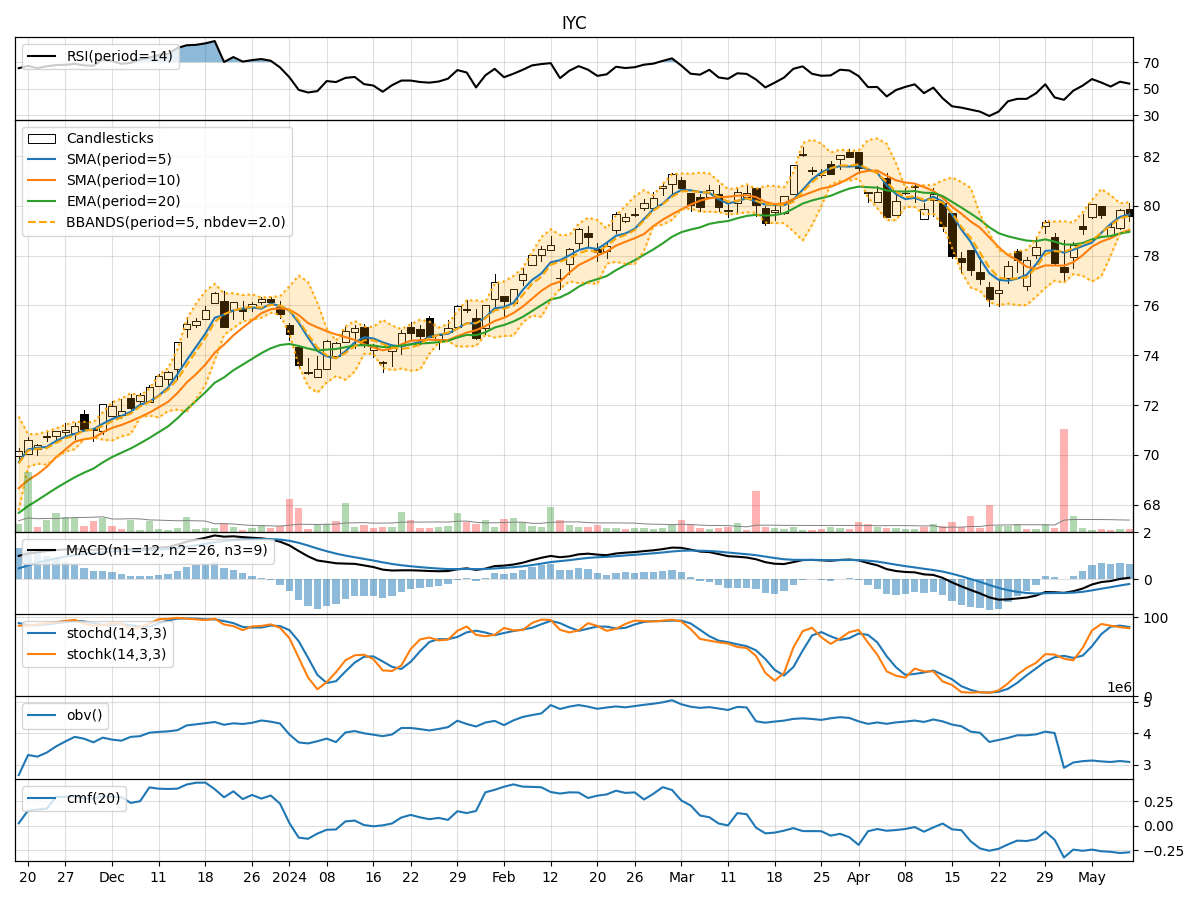
In analyzing the technical indicators for IYC over the last 5 days, we will delve into the trend, momentum, volatility, and volume indicators to provide a comprehensive outlook on the possible stock price movement in the coming days.
Trend Indicators:
- Moving Averages (MA): The 5-day MA has been consistently above the closing prices, indicating a short-term uptrend.
- MACD: The MACD line has been positive, suggesting bullish momentum.
- MACD Histogram: The histogram has been above the zero line, indicating increasing bullish momentum.
Key Observation: The trend indicators suggest a bullish sentiment in the short term.
Momentum Indicators:
- RSI: The RSI has been fluctuating around the 50 level, indicating a neutral momentum.
- Stochastic Oscillator: Both %K and %D have been in the overbought zone, signaling a potential reversal.
- Williams %R: The indicator has been hovering in the oversold territory, suggesting a possible upward movement.
Key Observation: Momentum indicators are mixed, with a slight bias towards a potential reversal.
Volatility Indicators:
- Bollinger Bands: The price has been trading within the bands, indicating normal volatility.
- Bollinger %B: The %B indicator has been fluctuating around the midline, suggesting a balanced market sentiment.
Key Observation: Volatility indicators point towards a stable market environment with no extreme price movements expected.
Volume Indicators:
- On-Balance Volume (OBV): The OBV has been declining, indicating selling pressure.
- Chaikin Money Flow (CMF): The CMF has been negative, suggesting outflow of money from the stock.
Key Observation: Volume indicators reflect a bearish sentiment with decreasing buying interest.
Conclusion:
Based on the analysis of the technical indicators, the stock price of IYC is likely to experience a short-term upward movement. The trend indicators support a bullish outlook, while momentum indicators show a potential reversal in momentum. Volatility indicators suggest a stable market environment, and volume indicators indicate a bearish sentiment but not strong enough to counter the overall bullish trend.
Overall, the next few days are likely to see an upward movement in the stock price of IYC, with a potential reversal in momentum and stable volatility. Investors should consider this analysis along with other fundamental factors before making any investment decisions.