Technical Analysis of IYE 2024-05-10
Overview:
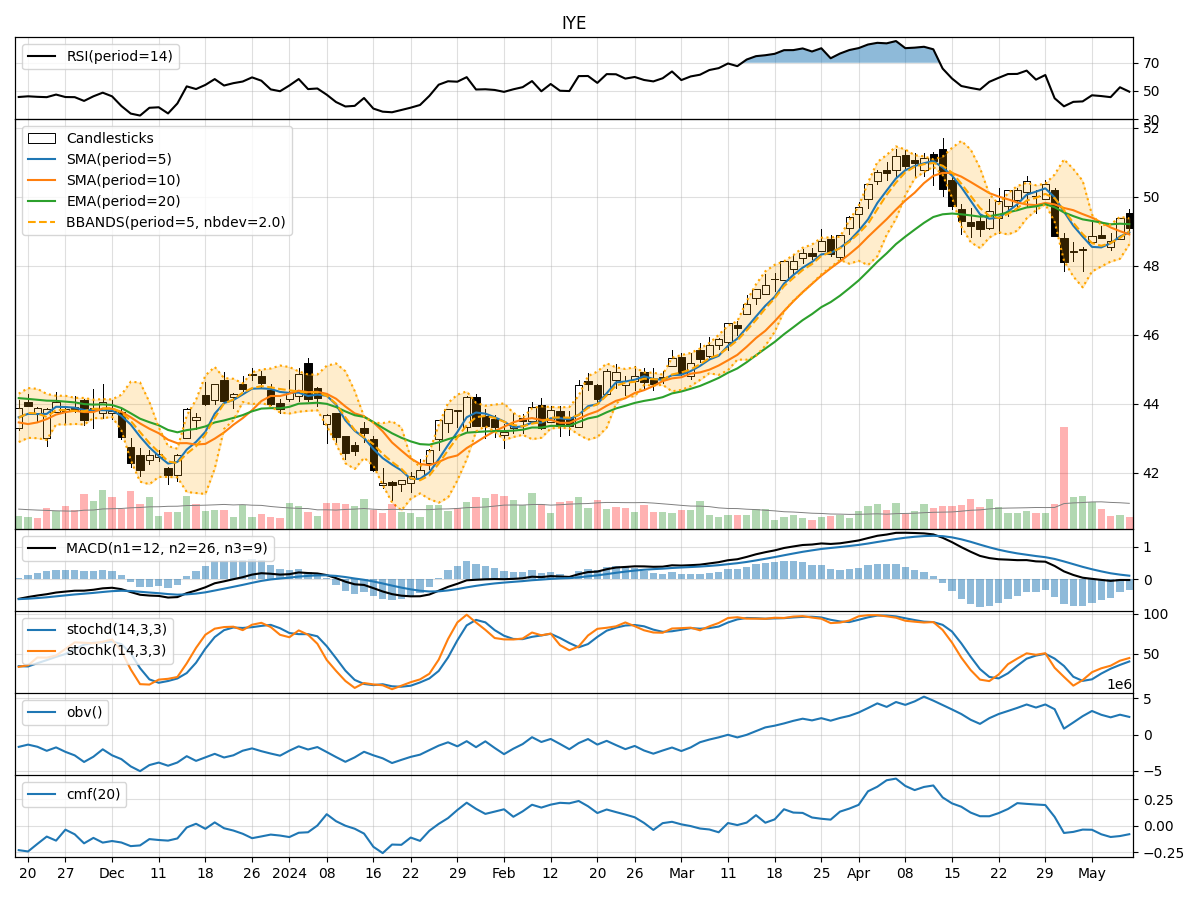
In analyzing the technical indicators for IYE over the last 5 days, we will delve into the trend, momentum, volatility, and volume indicators to provide a comprehensive outlook on the possible stock price movement in the coming days. By examining these key aspects, we aim to offer valuable insights and recommendations for your investment decisions.
Trend Analysis:
- Moving Averages (MA): The 5-day Moving Average (MA) has been fluctuating around the closing prices, indicating short-term price trends. The Simple Moving Average (SMA) and Exponential Moving Average (EMA) show a downward trend, suggesting a bearish sentiment.
- MACD: The Moving Average Convergence Divergence (MACD) has been negative, with the MACD line consistently below the signal line. This indicates a bearish momentum in the stock price.
- Conclusion: The trend indicators suggest a bearish outlook for IYE in the short term.
Momentum Analysis:
- RSI: The Relative Strength Index (RSI) has been fluctuating but is currently below 50, indicating a bearish momentum.
- Stochastic Oscillator: Both %K and %D lines of the Stochastic Oscillator are below 50, signaling a bearish momentum.
- Conclusion: The momentum indicators align with the trend indicators, suggesting a bearish momentum for IYE.
Volatility Analysis:
- Bollinger Bands (BB): The Bollinger Bands show a narrowing of the bands, indicating decreasing volatility in the stock price.
- Conclusion: The volatility indicators suggest a decreasing volatility in IYE, which could lead to a period of consolidation or a potential breakout.
Volume Analysis:
- On-Balance Volume (OBV): The OBV has been fluctuating but shows a slight decrease, indicating a divergence between volume and price movement.
- Chaikin Money Flow (CMF): The CMF is negative, suggesting a bearish pressure on the stock.
- Conclusion: The volume indicators point towards a bearish sentiment in the market.
Overall Conclusion:
Based on the analysis of trend, momentum, volatility, and volume indicators, the overall outlook for IYE in the next few days is bearish. The convergence of bearish signals across all indicators indicates a high probability of downward price movement. Traders and investors should exercise caution and consider potential short-selling or hedging strategies to mitigate risks in the current market environment.
Key Takeaways:
- The stock is likely to experience a downward trend in the coming days.
- Volatility is expected to decrease, potentially leading to a period of consolidation.
- Momentum and volume indicators support a bearish outlook for IYE.
- Traders should closely monitor key support levels and consider implementing risk management strategies to navigate the market conditions effectively.
By incorporating these insights into your investment strategy, you can make well-informed decisions aligned with the prevailing market dynamics.