Technical Analysis of IYR 2024-05-10
Overview:
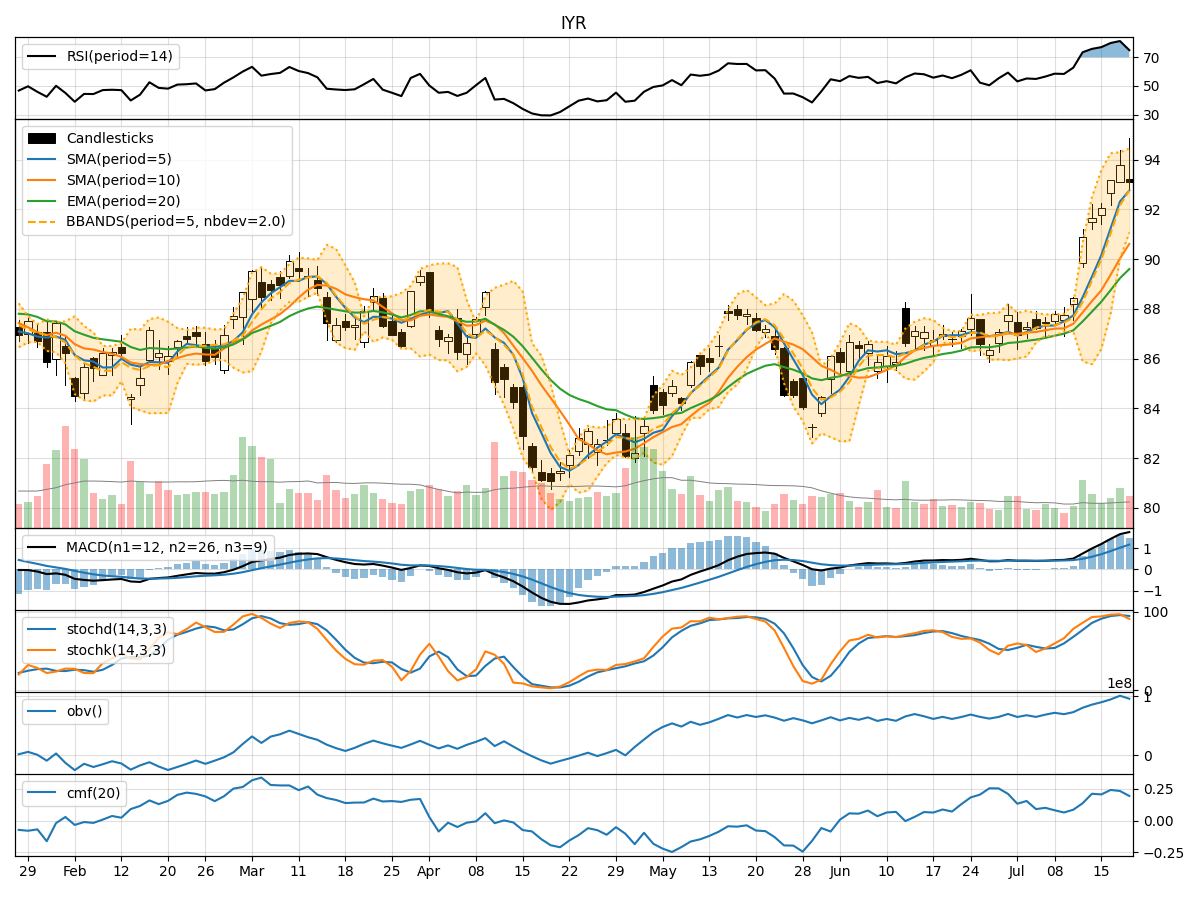
In the last 5 trading days, IYR has shown a mix of price movements and technical indicators. The stock price has fluctuated within a range, with some indicators suggesting potential bullish momentum while others indicate a possible consolidation phase. Let's delve deeper into the analysis of trend, momentum, volatility, and volume indicators to provide a comprehensive outlook on the next few days' possible stock price movement.
Trend Analysis:
- Moving Averages (MA): The 5-day Moving Average (MA) has been trending above the Simple Moving Average (SMA) and Exponential Moving Average (EMA), indicating a short-term bullish trend.
- MACD: The MACD line has been consistently below the signal line, suggesting a bearish momentum in the short term.
Key Observation: The moving averages signal a bullish trend, while the MACD indicates a bearish momentum.
Momentum Analysis:
- RSI: The Relative Strength Index (RSI) has been fluctuating around the neutral zone, indicating indecision in the market.
- Stochastic Oscillator: Both %K and %D lines of the Stochastic Oscillator have been in the overbought territory, suggesting a potential reversal.
Key Observation: The momentum indicators show conflicting signals, with RSI neutral and Stochastic Oscillator in the overbought zone.
Volatility Analysis:
- Bollinger Bands (BB): The stock price has mostly stayed within the Bollinger Bands, with the bands widening slightly, indicating increased volatility.
Key Observation: The Bollinger Bands suggest a moderate level of volatility in the stock price.
Volume Analysis:
- On-Balance Volume (OBV): The OBV has shown mixed movements, indicating uncertainty in the accumulation/distribution of the stock.
- Chaikin Money Flow (CMF): The CMF has been negative, reflecting selling pressure in the market.
Key Observation: Volume indicators reflect a lack of clear direction in the stock's accumulation/distribution and selling pressure.
Conclusion:
Based on the analysis of technical indicators, the next few days' possible stock price movement for IYR is likely to be sideways with a slight bearish bias. The conflicting signals from momentum indicators, coupled with the moderate volatility and mixed volume movements, suggest a lack of strong conviction in either direction. Traders should exercise caution and closely monitor key support and resistance levels for potential entry or exit points.
Key Recommendations:
- Monitor Support and Resistance Levels: Keep a close eye on key support and resistance levels to gauge potential breakout or breakdown scenarios.
- Wait for Confirmation: Wait for clearer signals from technical indicators before making significant trading decisions.
- Consider Risk Management: Implement proper risk management strategies to protect capital in case of unexpected price movements.
By considering the comprehensive analysis of trend, momentum, volatility, and volume indicators, traders can make informed decisions and navigate the market dynamics effectively.