Technical Analysis of IYZ 2024-05-10
Overview:
In analyzing the technical indicators for IYZ over the last 5 days, we will delve into the trend, momentum, volatility, and volume indicators to provide a comprehensive outlook on the possible stock price movement in the coming days. By examining these key indicators, we aim to offer valuable insights and predictions for informed decision-making.
Trend Analysis:
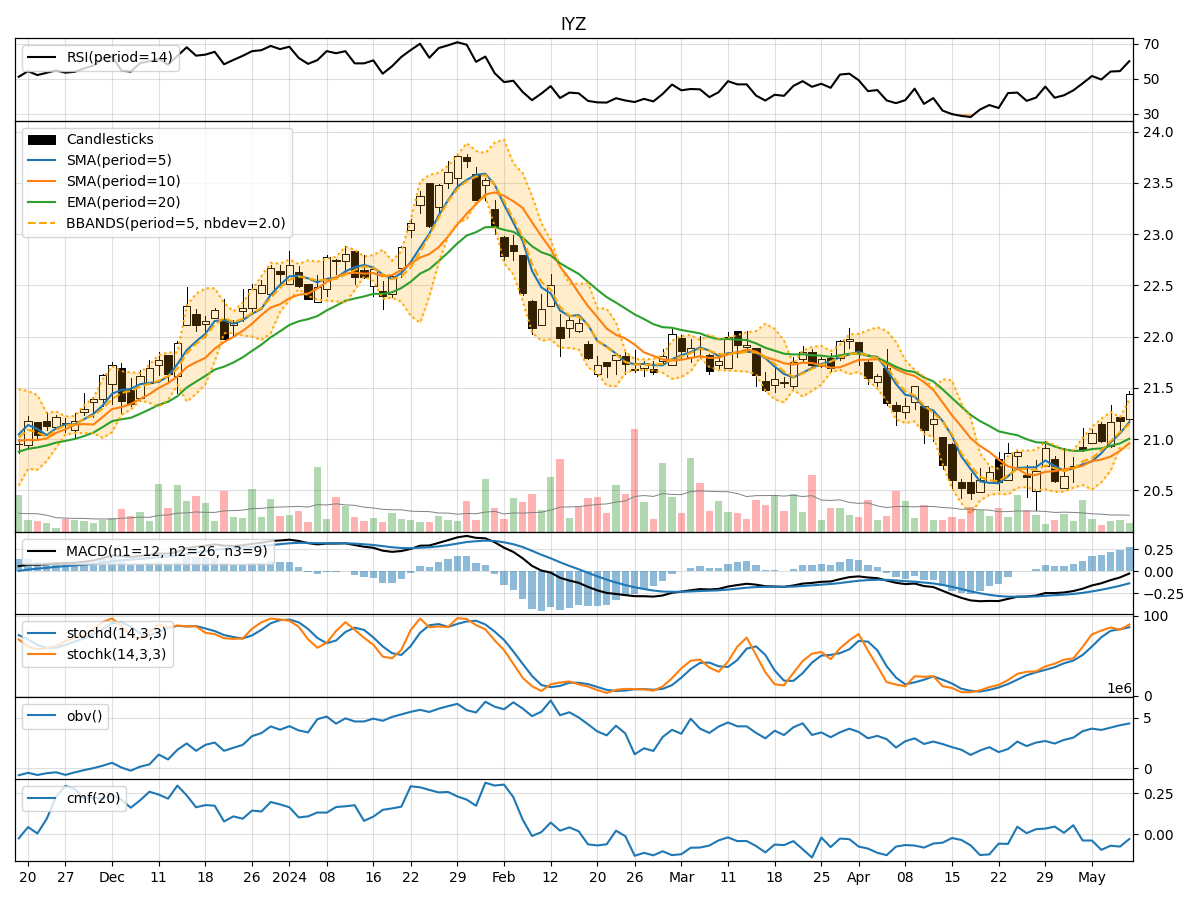
- Moving Averages (MA): The 5-day Moving Average (MA) has been consistently above the Simple Moving Average (SMA) and Exponential Moving Average (EMA), indicating a short-term uptrend.
- MACD: The MACD line has been negative but trending upwards, while the MACD Histogram is also showing an increasing trend, suggesting a potential bullish momentum.
Momentum Analysis:
- RSI: The Relative Strength Index (RSI) has been fluctuating around the 50 level, indicating a neutral momentum.
- Stochastic Oscillator: Both %K and %D lines of the Stochastic Oscillator are in the overbought region, signaling a potential reversal or consolidation.
Volatility Analysis:
- Bollinger Bands (BB): The stock price has been trading within the Bollinger Bands, with the bands widening slightly, indicating increased volatility.
- Bollinger %B: The %B indicator is above 0.5, suggesting that the stock price is closer to the upper band, potentially indicating an overbought condition.
Volume Analysis:
- On-Balance Volume (OBV): The OBV has been fluctuating, indicating indecision among market participants.
- Chaikin Money Flow (CMF): The CMF has been negative, reflecting selling pressure in the stock.
Key Observations:
- The trend indicators suggest a potential bullish bias in the short term.
- Momentum indicators show a neutral stance with a slight overbought signal from the Stochastic Oscillator.
- Volatility has increased slightly, indicating potential price swings.
- Volume indicators reflect mixed sentiment with selling pressure based on CMF.
Conclusion:
Based on the analysis of the technical indicators, the next few days' possible stock price movement for IYZ could be upward with a bullish bias in the short term. However, caution is advised as the Stochastic Oscillator signals potential overbought conditions, and the CMF indicates selling pressure. Traders and investors should closely monitor price action and key support/resistance levels for confirmation of the bullish momentum.