Technical Analysis of JAAA 2024-05-10
Overview:
In analyzing the technical indicators for JAAA stock over the last 5 days, we will delve into the trend, momentum, volatility, and volume indicators to provide a comprehensive outlook on the possible stock price movement in the coming days. By examining these key indicators, we aim to offer valuable insights and predictions to guide your investment decisions.
Trend Analysis:
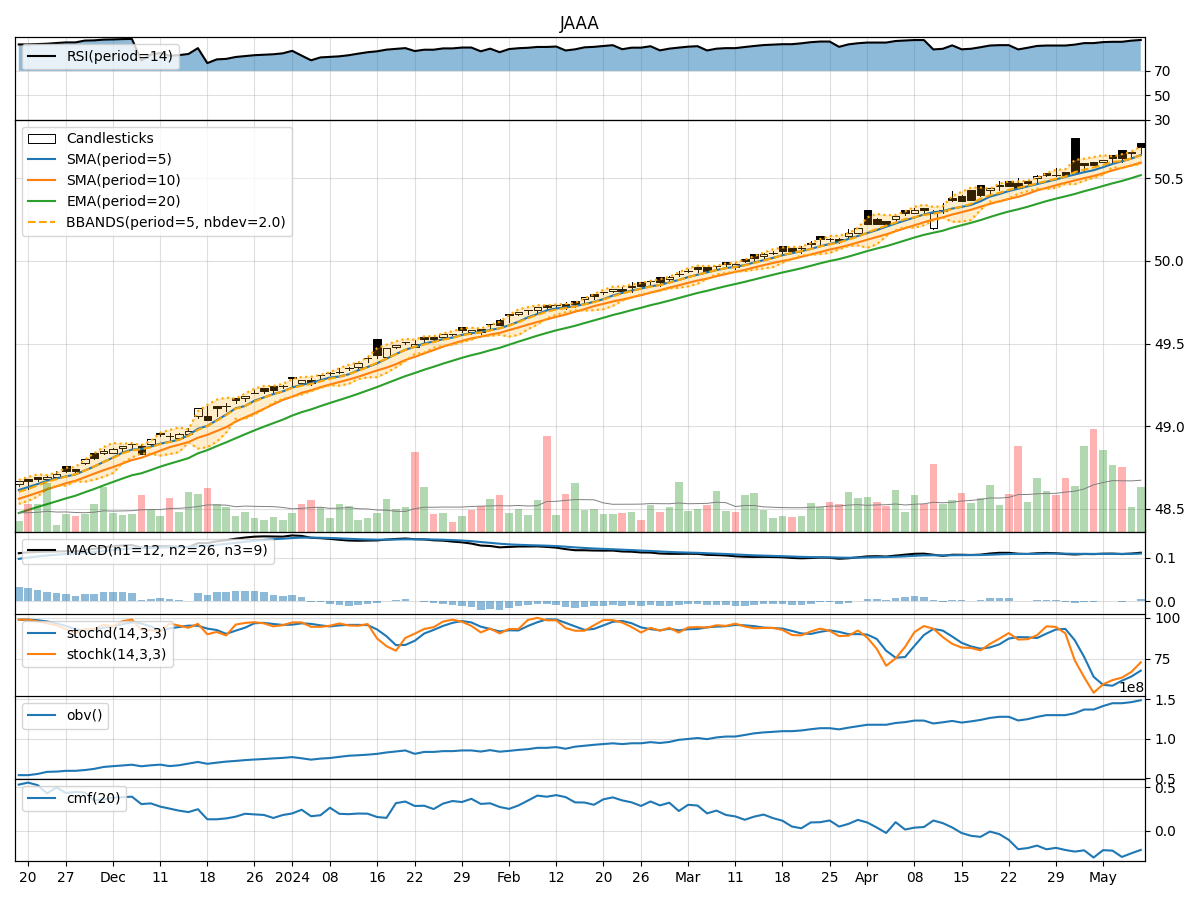
- Moving Averages (MA): The 5-day Moving Average (MA) has been consistently rising, indicating an upward trend in the stock price.
- MACD: The Moving Average Convergence Divergence (MACD) has shown positive values, suggesting bullish momentum.
- EMA: The Exponential Moving Average (EMA) has also been trending upwards, supporting the bullish sentiment.
Momentum Analysis:
- RSI: The Relative Strength Index (RSI) has been in the overbought territory, indicating strong buying momentum.
- Stochastic Oscillator: Both %K and %D have been increasing, signaling strong upward momentum.
- Williams %R: The Williams %R is in the oversold region, suggesting a potential reversal in the short term.
Volatility Analysis:
- Bollinger Bands: The Bollinger Bands have been widening, indicating increased volatility in the stock price.
- Bollinger %B: The %B indicator has been fluctuating within a wide range, reflecting the heightened volatility.
Volume Analysis:
- On-Balance Volume (OBV): The OBV has been increasing, showing accumulation by investors.
- Chaikin Money Flow (CMF): The CMF has been negative, indicating selling pressure in the stock.
Key Observations:
- The trend indicators suggest a strong bullish sentiment with rising moving averages and positive MACD values.
- Momentum indicators point towards overbought conditions, which may lead to a short-term correction.
- Volatility has been increasing, indicating potential price swings in the coming days.
- Volume analysis shows mixed signals with OBV rising but CMF being negative.
Conclusion:
Based on the analysis of the technical indicators, the stock is likely to experience a short-term correction due to the overbought conditions indicated by the momentum indicators. However, the overall trend remains bullish, supported by the positive trend indicators. Traders should be cautious of the increased volatility and monitor the price action closely for potential entry or exit points. Consider taking profits on long positions and wait for a pullback before considering new positions.