Technical Analysis of JAND 2024-05-10
Overview:
In analyzing the technical indicators for JAND stock over the last 5 days, we will delve into the trend, momentum, volatility, and volume indicators to provide a comprehensive outlook on the possible stock price movement in the coming days. By examining these key indicators, we aim to offer valuable insights and predictions for potential investors.
Trend Indicators:
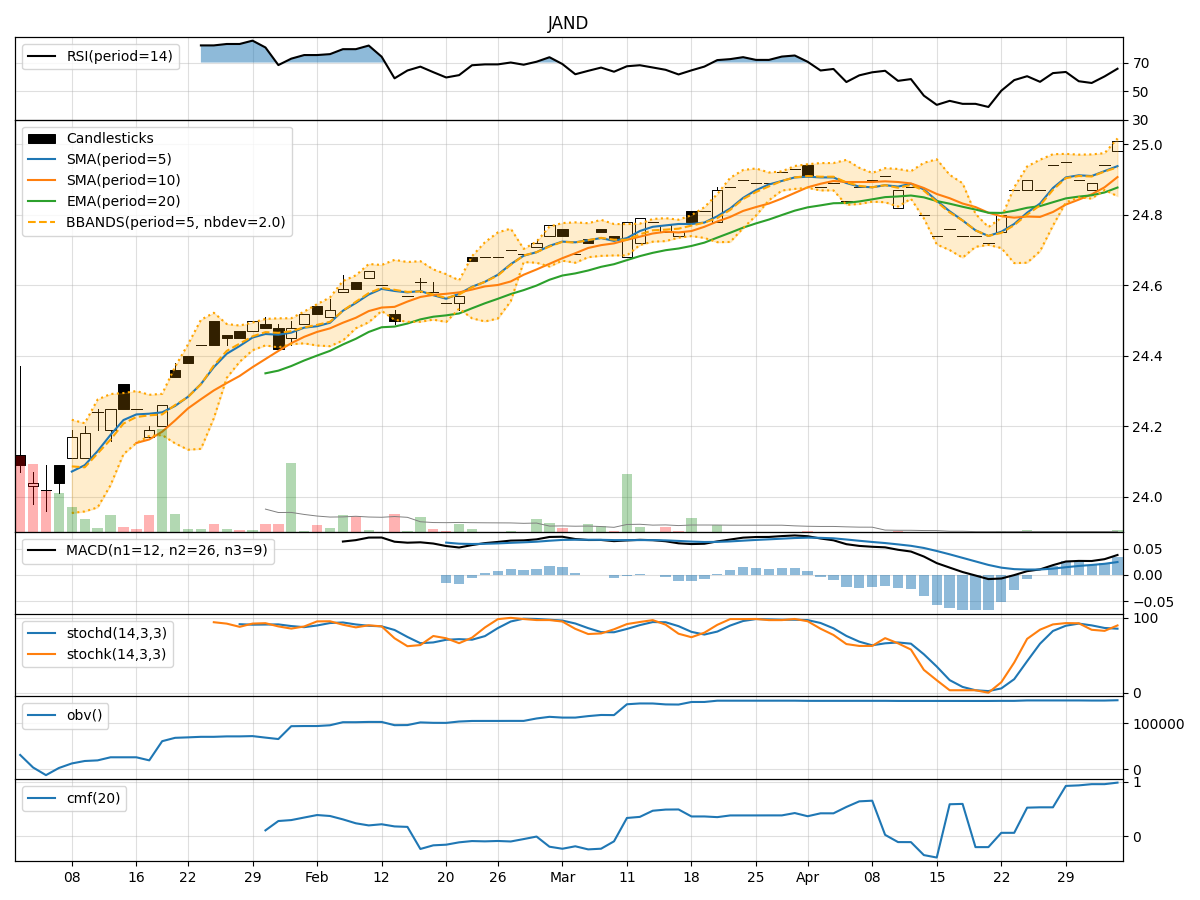
- Moving Averages (MA): The 5-day moving average has been consistently above the simple moving average (SMA) of 10 days, indicating a short-term bullish trend.
- Exponential Moving Average (EMA): The EMA has been steadily increasing, reflecting positive price momentum.
- MACD: The MACD line has been above the signal line, suggesting bullish momentum.
- Conclusion: The trend indicators point towards an upward trend for JAND stock.
Momentum Indicators:
- Relative Strength Index (RSI): The RSI has been increasing, indicating strengthening buying pressure.
- Stochastic Oscillator: Both %K and %D have been at 100%, signaling overbought conditions.
- Williams %R: The indicator has consistently been at 0, reflecting overbought conditions.
- Conclusion: Momentum indicators suggest that the stock is currently overbought and may experience a potential pullback.
Volatility Indicators:
- Bollinger Bands (BB): The stock price has been trading within the upper Bollinger Band, indicating increased volatility.
- Conclusion: Volatility indicators suggest that there is increased volatility in the stock price.
Volume Indicators:
- On-Balance Volume (OBV): The OBV has been relatively stable, indicating consistent buying volume.
- Chaikin Money Flow (CMF): The CMF has been positive, reflecting buying pressure.
- Conclusion: Volume indicators suggest that there is consistent buying volume supporting the stock price.
Overall Conclusion:
Based on the analysis of the technical indicators, the upward trend in the stock price is likely to continue in the short term. However, the overbought conditions indicated by the momentum indicators may lead to a potential pullback or consolidation in the near future. The increased volatility suggests that traders should be cautious of sudden price movements. The consistent buying volume indicated by volume indicators supports the bullish outlook.
Recommendation:
- Short-Term: Consider taking profits or setting stop-loss orders due to overbought conditions.
- Long-Term: Monitor the stock closely for any signs of reversal or consolidation before making further investment decisions.
In conclusion, while the technical indicators point towards an upward trend for JAND stock, investors should exercise caution and closely monitor the market dynamics to make informed decisions.