Technical Analysis of JANH 2024-05-10
Overview:
In analyzing the technical indicators for JANH stock over the last 5 days, we will delve into the trend, momentum, volatility, and volume indicators to provide a comprehensive outlook on the possible stock price movement in the coming days. By examining these key aspects, we aim to offer valuable insights and predictions to guide your investment decisions.
Trend Indicators:
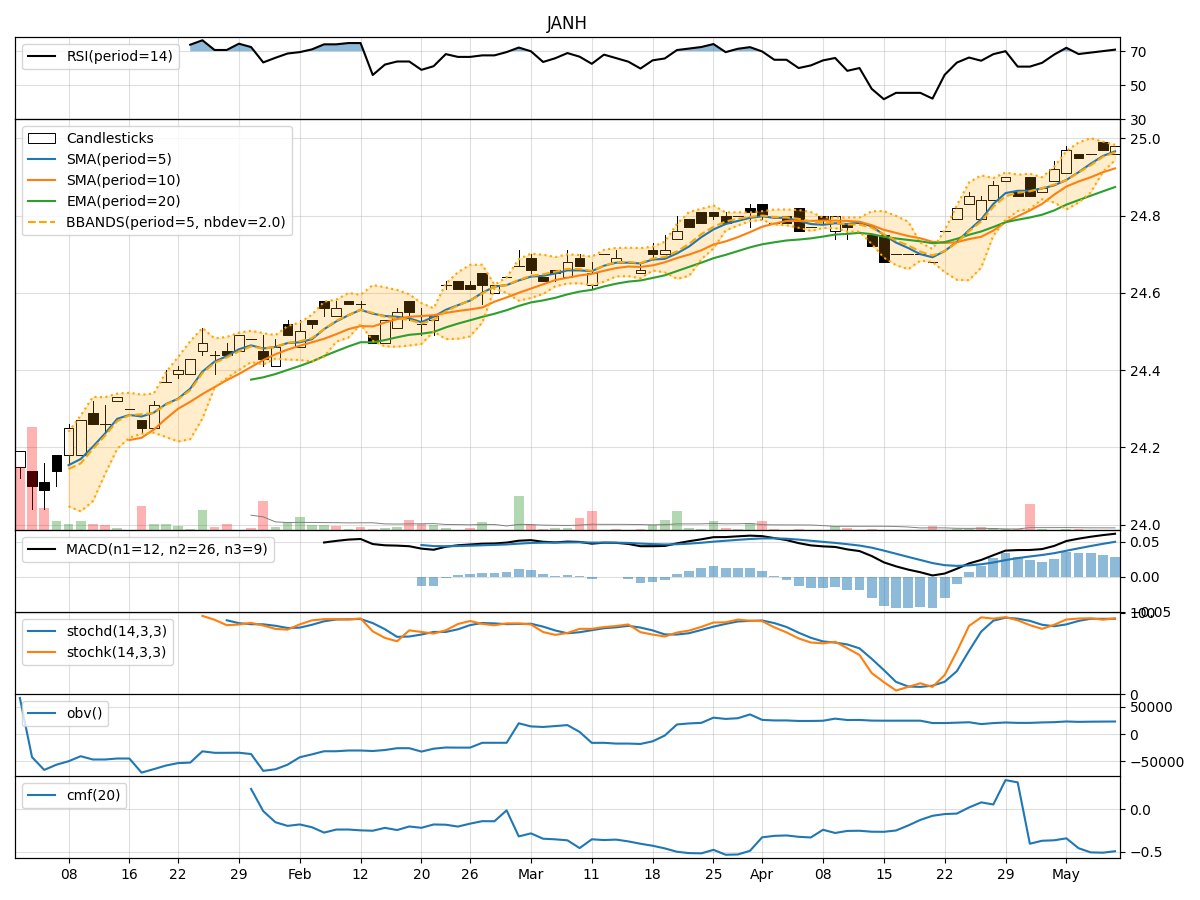
- Moving Averages (MA): The 5-day MA has been consistently above the 10-day SMA, indicating a short-term bullish trend.
- MACD: The MACD line has been consistently above the signal line, suggesting positive momentum in the stock price.
- EMA: The exponential moving average has been trending upwards, reflecting a bullish sentiment in the market.
Momentum Indicators:
- RSI: The Relative Strength Index has been in the overbought territory, indicating a strong bullish momentum.
- Stochastic Oscillator: Both %K and %D lines have been in the overbought zone, signaling a potential reversal or consolidation.
- Williams %R: The Williams %R has been consistently in the oversold region, suggesting a possible reversal in the stock price.
Volatility Indicators:
- Bollinger Bands: The stock price has been trading within the upper Bollinger Band, indicating a period of high volatility and potential overbought conditions.
- Bollinger Band Width: The Band Width has been narrowing, suggesting a potential decrease in volatility and a period of consolidation.
Volume Indicators:
- On-Balance Volume (OBV): The OBV has been relatively stable, indicating a balance between buying and selling pressure.
- Chaikin Money Flow (CMF): The CMF has been negative, suggesting a lack of buying interest in the stock.
Key Observations and Opinions:
- Trend: The trend indicators suggest a bullish sentiment in the short term.
- Momentum: While momentum indicators show strong bullish momentum, the overbought conditions indicate a potential reversal or consolidation.
- Volatility: The narrowing Bollinger Bands and decreasing volatility point towards a period of consolidation.
- Volume: The volume indicators reflect a lack of significant buying interest in the stock.
Conclusion:
Based on the analysis of the technical indicators, the stock price of JANH is likely to experience consolidation in the coming days. The bullish trend may lose momentum, leading to a period of sideways movement. Traders should exercise caution and consider potential profit-taking opportunities as the stock price stabilizes.