Technical Analysis of JANP 2024-05-10
Overview:
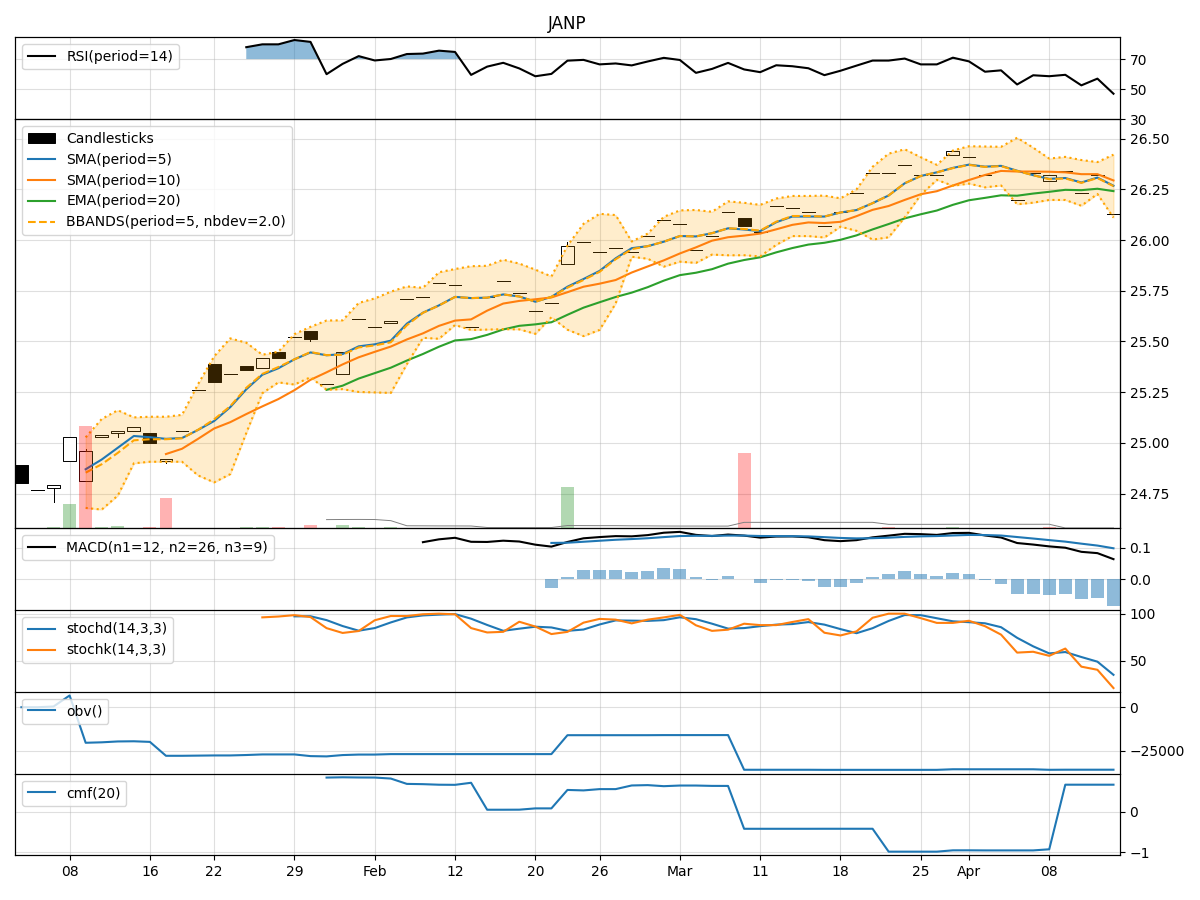
In analyzing the technical indicators for JANP over the last 5 days, we will delve into the trend, momentum, volatility, and volume indicators to provide a comprehensive outlook on the possible stock price movement in the coming days. By examining these key indicators, we aim to offer valuable insights and predictions for potential investors.
Trend Indicators:
- Moving Averages (MA): The 5-day MA has been consistently above the closing prices, indicating a bullish trend.
- MACD: The MACD line has been steadily increasing, with the MACD histogram and signal line also showing positive momentum.
- Conclusion: The trend indicators suggest an upward trend in the stock price.
Momentum Indicators:
- RSI: The RSI has been gradually increasing, indicating strengthening momentum.
- Stochastic Oscillator: Both %K and %D have been at 100%, signaling strong buying pressure.
- Conclusion: Momentum indicators point towards a bullish sentiment.
Volatility Indicators:
- Bollinger Bands (BB): The bands have been narrowing, suggesting decreasing volatility.
- Conclusion: Volatility indicators indicate a consolidation phase with reduced price fluctuations.
Volume Indicators:
- On-Balance Volume (OBV): The OBV has remained constant, indicating a balance between buying and selling pressure.
- Chaikin Money Flow (CMF): The CMF has been positive, reflecting buying pressure.
- Conclusion: Volume indicators suggest a neutral stance with balanced trading activity.
Overall Conclusion:
Based on the analysis of trend, momentum, volatility, and volume indicators, the overall outlook for JANP in the next few days is bullish. The stock is likely to continue its upward trend with strong momentum and stable volume. The consolidation phase indicated by volatility indicators may lead to a brief period of sideways movement before potential further upside. Investors could consider buying opportunities in anticipation of a continued uptrend.
Key Takeaways:
- Upward Trend: Trend indicators support a bullish view.
- Strong Momentum: Momentum indicators signal a positive sentiment.
- Consolidation: Volatility indicators suggest a period of stability.
- Balanced Volume: Volume indicators indicate neutral trading activity.
In conclusion, considering the collective analysis of technical indicators, the next few days for JANP are likely to see upward movement in stock price. Investors should monitor the indicators closely for any shifts in market dynamics that may impact the stock's performance.