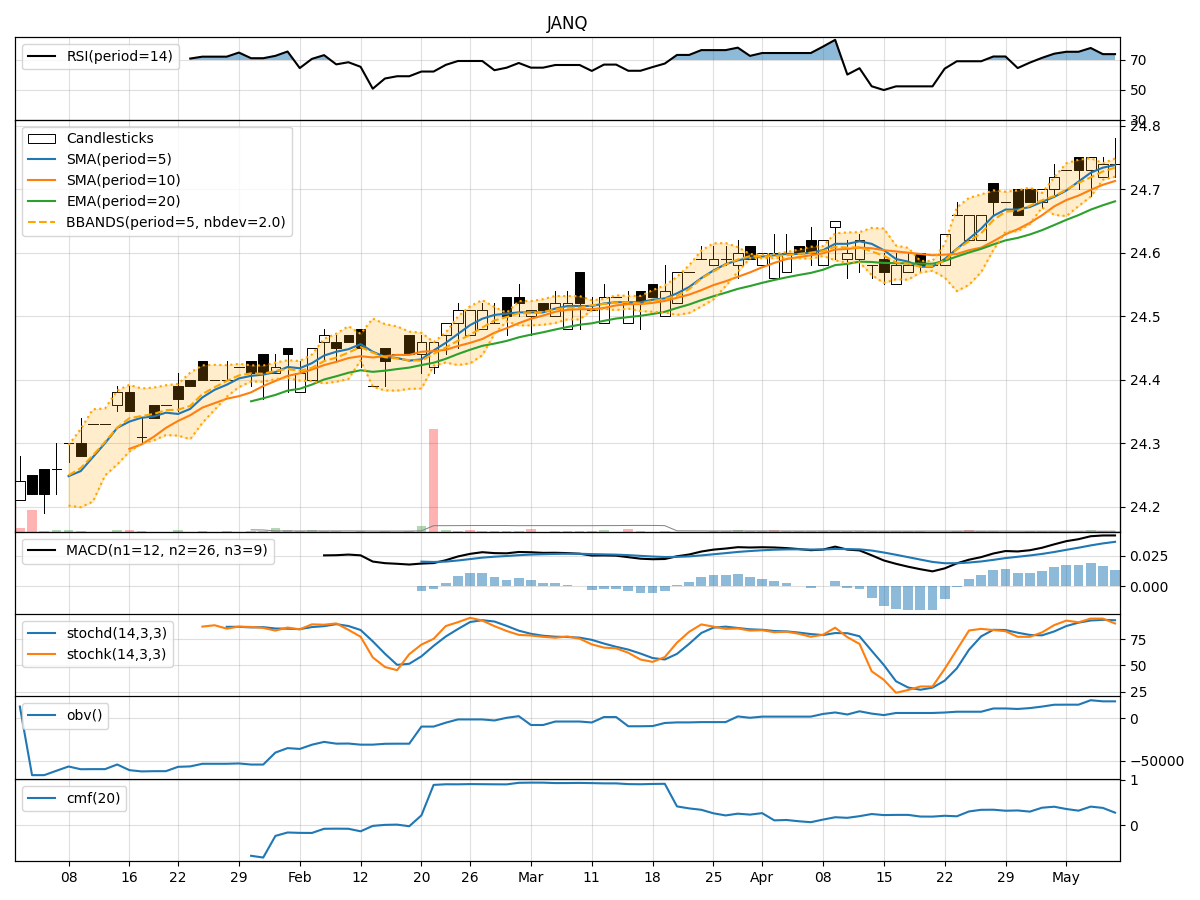
Technical Analysis of JANQ 2024-05-10
Overview:
In analyzing the technical indicators for JANQ stock over the last 5 days, we will delve into the trends, momentum, volatility, and volume aspects to provide a comprehensive outlook on the possible stock price movement. By examining key indicators such as moving averages, MACD, RSI, Stochastic Oscillator, Bollinger Bands, and OBV, we aim to offer valuable insights and predictions for the upcoming trading days.
Trend Analysis:
- Moving Averages (MA): The 5-day MA has been consistently above the closing price, indicating a short-term uptrend.
- MACD: The MACD line has been trending upwards, staying above the signal line, suggesting bullish momentum.
- EMA: The EMA has been steadily increasing, supporting the bullish trend.
Key Observation: The trend indicators point towards an upward trajectory for JANQ stock.
Momentum Analysis:
- RSI: The RSI has been fluctuating but generally staying in the overbought territory, reflecting strong buying momentum.
- Stochastic Oscillator: Both %K and %D have been relatively high, indicating bullish momentum.
- Williams %R: The indicator has been in the oversold region, suggesting a potential reversal.
Key Observation: Momentum indicators signal a bullish sentiment for JANQ stock.
Volatility Analysis:
- Bollinger Bands: The stock price has been trading within the bands, with the bands narrowing, indicating reduced volatility.
Key Observation: Volatility is decreasing, possibly leading to a period of consolidation or sideways movement.
Volume Analysis:
- On-Balance Volume (OBV): The OBV has been relatively stable, suggesting consistent buying interest.
- Chaikin Money Flow (CMF): The CMF has shown positive values, indicating money flow into the stock.
Key Observation: Volume indicators support the bullish outlook for JANQ stock.
Conclusion:
Based on the analysis of trend, momentum, volatility, and volume indicators, the overall outlook for JANQ stock is bullish. The trend is upward, momentum is strong, and volume is supportive of further price appreciation. While a period of consolidation or sideways movement may occur due to decreasing volatility, the overall bias remains bullish. Investors may consider buying opportunities in anticipation of potential price appreciation in the coming days.