Technical Analysis of JANT 2024-05-10
Overview:
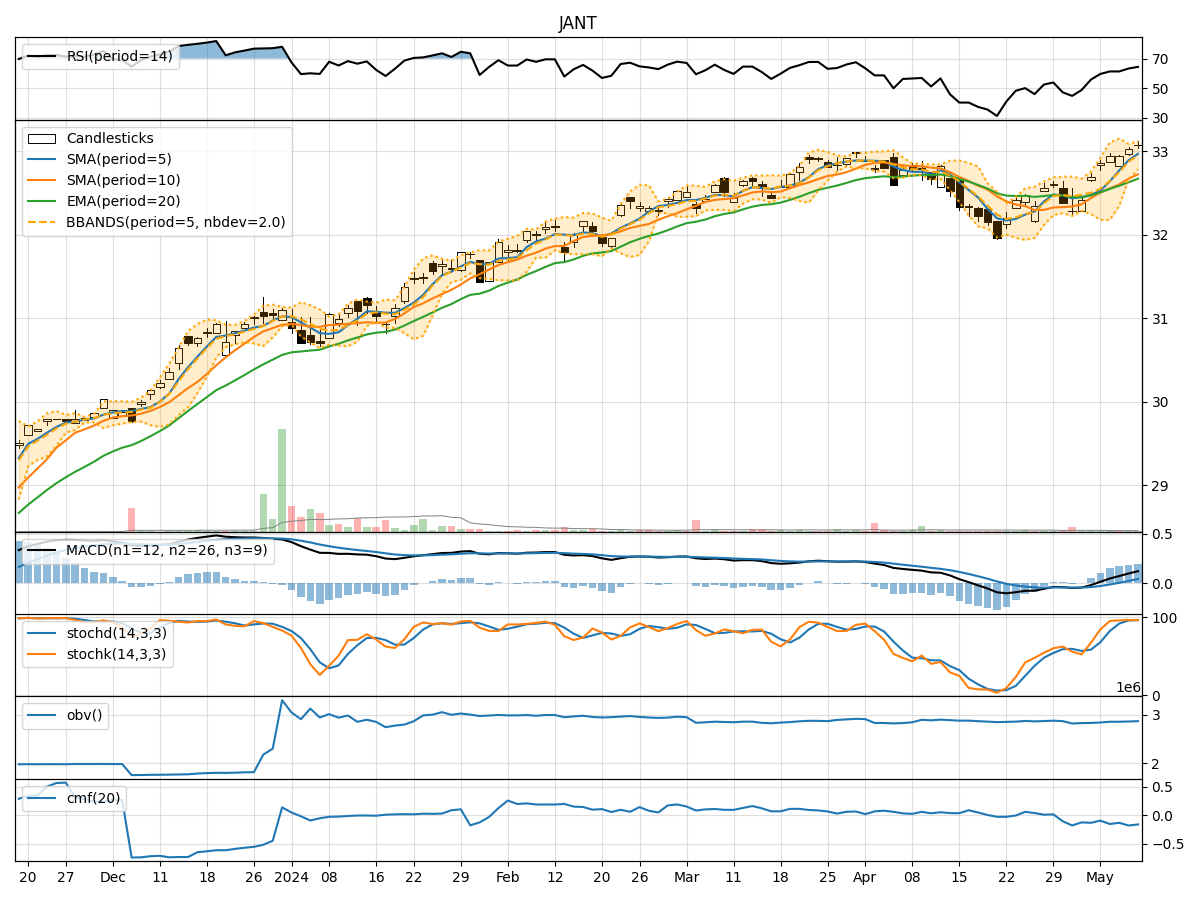
In analyzing the technical indicators for JANT stock over the last 5 days, we will delve into the trend, momentum, volatility, and volume indicators to provide a comprehensive outlook on the possible stock price movement in the coming days. By examining these key indicators, we aim to offer valuable insights and predictions for potential investors.
Trend Analysis:
- Moving Averages (MA): The 5-day Moving Average (MA) has been consistently above the Simple Moving Average (SMA) and Exponential Moving Average (EMA), indicating a bullish trend.
- MACD: The MACD line has been consistently above the signal line, suggesting positive momentum in the stock price.
- RSI: The Relative Strength Index (RSI) has been trending upwards, indicating increasing buying pressure.
Momentum Analysis:
- Stochastic Oscillator: Both %K and %D lines of the Stochastic Oscillator have been in the overbought zone, signaling a strong bullish momentum.
- Williams %R: The Williams %R indicator has been consistently in the oversold territory, indicating a potential reversal in the stock price.
Volatility Analysis:
- Bollinger Bands: The stock price has been trading within the Bollinger Bands, with the bands narrowing, suggesting a period of consolidation.
- Volatility Percentage: The volatility percentage has been decreasing, indicating a decrease in price fluctuations.
Volume Analysis:
- On-Balance Volume (OBV): The OBV has been declining, suggesting a decrease in buying pressure.
- Chaikin Money Flow (CMF): The CMF has been negative, indicating a lack of buying interest in the stock.
Conclusion:
Based on the analysis of the technical indicators, the stock is currently exhibiting strong bullish momentum with positive trend signals. However, the declining OBV and negative CMF suggest a potential weakening in buying interest. The narrowing Bollinger Bands and decreasing volatility indicate a period of consolidation.
Forecast:
Considering the overall bullish momentum and positive trend signals, the stock is likely to experience further upside movement in the coming days. However, investors should closely monitor the OBV and CMF for any signs of reversal in buying interest. Additionally, a breakout above the upper Bollinger Band could signal a continuation of the bullish trend.
Recommendation:
Based on the current technical indicators, it is recommended to consider buying the stock for potential short to medium-term gains. However, it is crucial to set stop-loss levels to manage risk effectively. Monitoring key support and resistance levels along with volume patterns will be essential for making informed trading decisions.