Technical Analysis of JANW 2024-05-10
Overview:
In analyzing the technical indicators for JANW over the last 5 days, we will delve into the trend, momentum, volatility, and volume indicators to provide a comprehensive outlook on the possible stock price movement. By examining these key aspects, we aim to offer valuable insights and predictions for the upcoming trading days.
Trend Indicators:
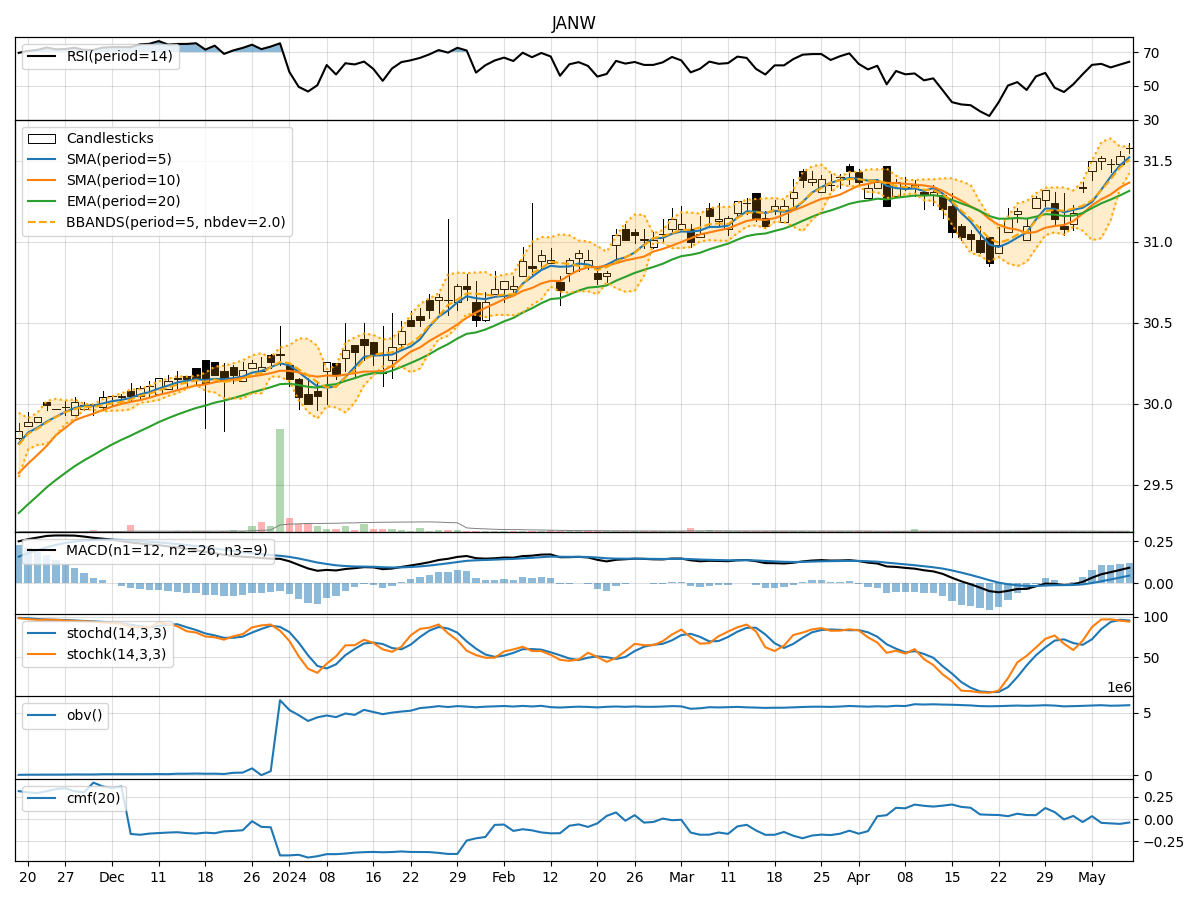
- Moving Averages (MA): The 5-day Moving Average (MA) has been consistently above the Simple Moving Average (SMA) and Exponential Moving Average (EMA), indicating a bullish trend.
- MACD: The MACD line has been consistently above the signal line, with both lines showing an upward trend, suggesting bullish momentum.
- MACD Histogram: The MACD Histogram has been increasing over the past 5 days, indicating strengthening bullish momentum.
Momentum Indicators:
- RSI: The Relative Strength Index (RSI) has been in the range of 60-65, indicating a moderate level of buying pressure.
- Stochastic Oscillator: Both %K and %D lines of the Stochastic Oscillator have been above 80, suggesting an overbought condition.
- Williams %R: The Williams %R has been hovering around -5, indicating a near-overbought condition.
Volatility Indicators:
- Bollinger Bands: The stock price has been trading within the Bollinger Bands, with the bands narrowing over the past few days, indicating decreasing volatility.
- Bollinger %B: The %B indicator has been fluctuating around 0.9, suggesting the stock is trading close to the upper band.
Volume Indicators:
- On-Balance Volume (OBV): The OBV has shown a slight increase over the last 5 days, indicating some accumulation by investors.
- Chaikin Money Flow (CMF): The CMF has been negative, indicating some selling pressure in the stock.
Key Observations and Opinions:
- Trend: The trend indicators suggest a strong bullish sentiment in the stock, supported by the moving averages and MACD.
- Momentum: The momentum indicators indicate a slightly overbought condition, which may lead to a short-term pullback.
- Volatility: The narrowing Bollinger Bands suggest a period of consolidation or a potential breakout in the near future.
- Volume: The volume indicators show mixed signals, with OBV slightly positive but CMF negative, indicating a lack of strong buying interest.
Conclusion:
Based on the analysis of the technical indicators, the stock of JANW is currently in an upward trend with bullish momentum. However, the overbought conditions indicated by the momentum indicators and the narrowing volatility suggest a possible consolidation or pullback in the short term. Investors should closely monitor the price action for potential entry or exit points, considering the mixed signals from the volume indicators.