Technical Analysis of JDOC 2024-05-10
Overview:
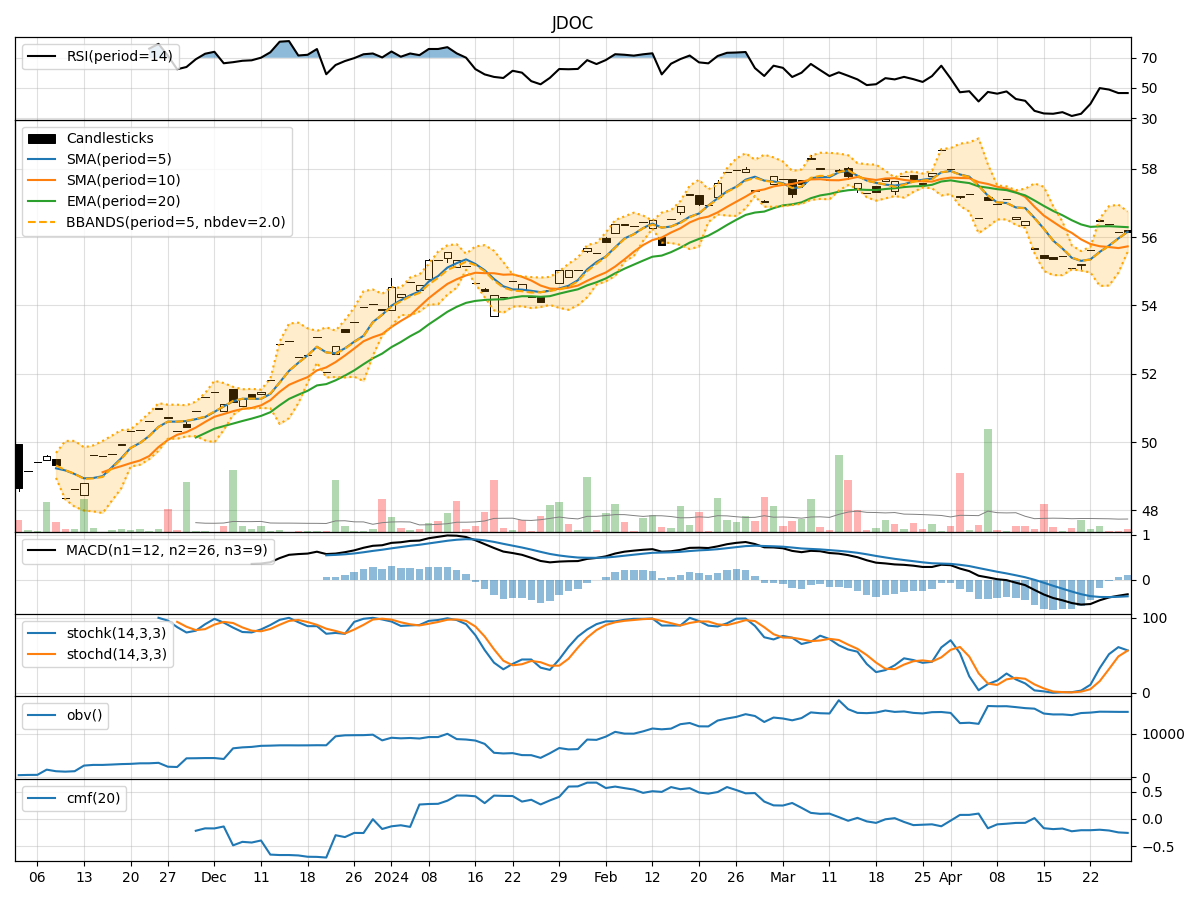
In analyzing the technical indicators for JDOC stock over the last 5 days, we will delve into the trend, momentum, volatility, and volume indicators to provide a comprehensive outlook on the possible stock price movement in the coming days. By examining these key indicators, we aim to offer valuable insights and predictions for potential investors.
Trend Analysis:
- Moving Averages (MA): The 5-day Moving Average (MA) has been consistently above the Simple Moving Average (SMA) and Exponential Moving Average (EMA), indicating a bullish trend.
- MACD: The MACD line has been consistently above the signal line, suggesting a bullish momentum in the stock price.
- MACD Histogram: The MACD Histogram has been consistently above the zero line, further confirming the bullish trend.
Momentum Analysis:
- RSI: The Relative Strength Index (RSI) has been fluctuating in the overbought territory, indicating strong buying momentum.
- Stochastic Oscillator: Both %K and %D lines of the Stochastic Oscillator have been relatively high, signaling a strong bullish momentum.
- Williams %R: The Williams %R has been hovering near oversold levels, suggesting a potential reversal in the short term.
Volatility Analysis:
- Bollinger Bands: The Bollinger Bands have been relatively narrow, indicating low volatility in the stock price.
- Bollinger %B: The %B indicator has been fluctuating around 1, suggesting the stock price is trading close to the upper band.
- Bollinger Band Width: The Band Width has been decreasing, indicating a potential decrease in volatility.
Volume Analysis:
- On-Balance Volume (OBV): The OBV indicator has been showing a slight increase, indicating a positive accumulation of volume.
- Chaikin Money Flow (CMF): The CMF has been positive, suggesting that money is flowing into the stock.
Conclusion:
Based on the analysis of the technical indicators, the next few days for JDOC stock are likely to see continued bullish momentum. The trend indicators, momentum indicators, and volume indicators all point towards a positive outlook for the stock price. The low volatility and positive accumulation of volume further support the bullish sentiment.
Recommendation:
Considering the overall bullish signals from the technical indicators, investors may consider buying or holding JDOC stock in the coming days. It is important to monitor the price action closely and set appropriate stop-loss levels to manage risk effectively. Additionally, keeping an eye on any news or external factors that may impact the stock price is crucial for making informed investment decisions.