Technical Analysis of JDVI 2024-05-10
Overview:
In analyzing the technical indicators for JDVI over the last 5 days, we will delve into the trend, momentum, volatility, and volume indicators to provide a comprehensive outlook on the possible stock price movement. By examining these key indicators, we aim to offer valuable insights and predictions for the upcoming days.
Trend Indicators:
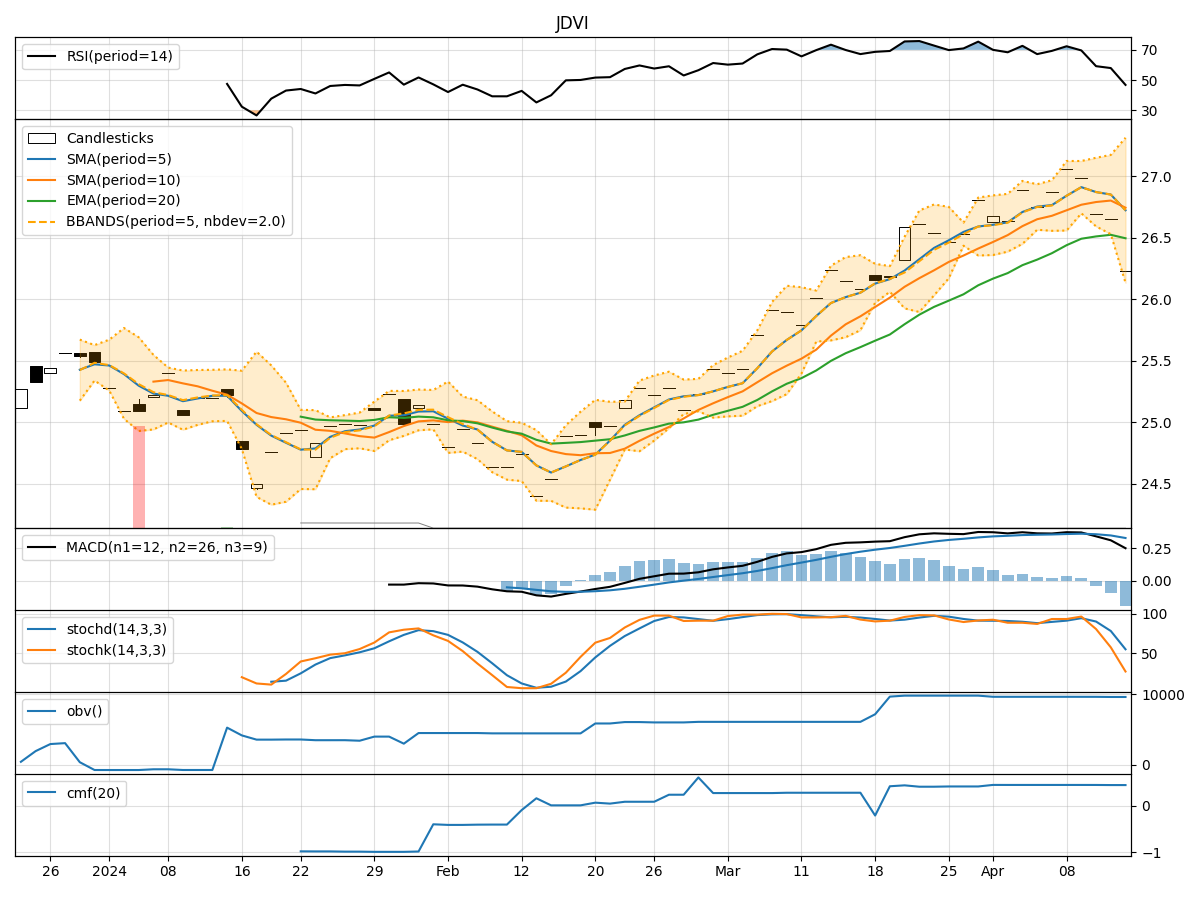
- Moving Averages (MA): The 5-day MA has been consistently above the closing prices, indicating an upward trend. Both the Simple Moving Average (SMA) and Exponential Moving Average (EMA) have been trending upwards, supporting a bullish view.
- MACD: The MACD line has been above the signal line for the past 5 days, with both lines showing an increasing positive divergence. This suggests bullish momentum in the stock price.
- MACD Histogram: The MACD Histogram has been steadily increasing, indicating strengthening bullish momentum.
Momentum Indicators:
- RSI: The Relative Strength Index (RSI) has been consistently above 50, indicating bullish momentum in the stock.
- Stochastic Oscillator: Both %K and %D have been at 100%, suggesting the stock is in overbought territory.
- Williams %R: The Williams %R has consistently been at 0, indicating an overbought condition.
Volatility Indicators:
- Bollinger Bands: The stock price has been consistently trading above the middle Bollinger Band (BBM), indicating an upward trend. The narrowing of the bands suggests decreasing volatility.
- Bollinger %B: The %B has been above 0.5 for the past 5 days, indicating that the stock price is above the middle band and in an uptrend.
Volume Indicators:
- On-Balance Volume (OBV): The OBV has been steadily increasing over the last 5 days, indicating positive buying pressure.
- Chaikin Money Flow (CMF): The CMF has been at 0, suggesting neutral money flow in the stock.
Conclusion:
Based on the analysis of the technical indicators, the stock of JDVI is exhibiting strong bullish signals across trend, momentum, and volume indicators. The moving averages, MACD, RSI, and OBV all point towards an upward trend with bullish momentum. However, the stock is currently in overbought territory according to the Stochastic Oscillator and Williams %R.
Recommendation:
Considering the overall bullish outlook but the overbought conditions, it is likely that the stock price of JDVI may experience a short-term consolidation or pullback in the next few days. Traders should exercise caution and consider potential profit-taking opportunities. Long-term investors may use any dips as buying opportunities to capitalize on the overall bullish trend in the stock.