Technical Analysis of JEMA 2024-05-10
Overview:
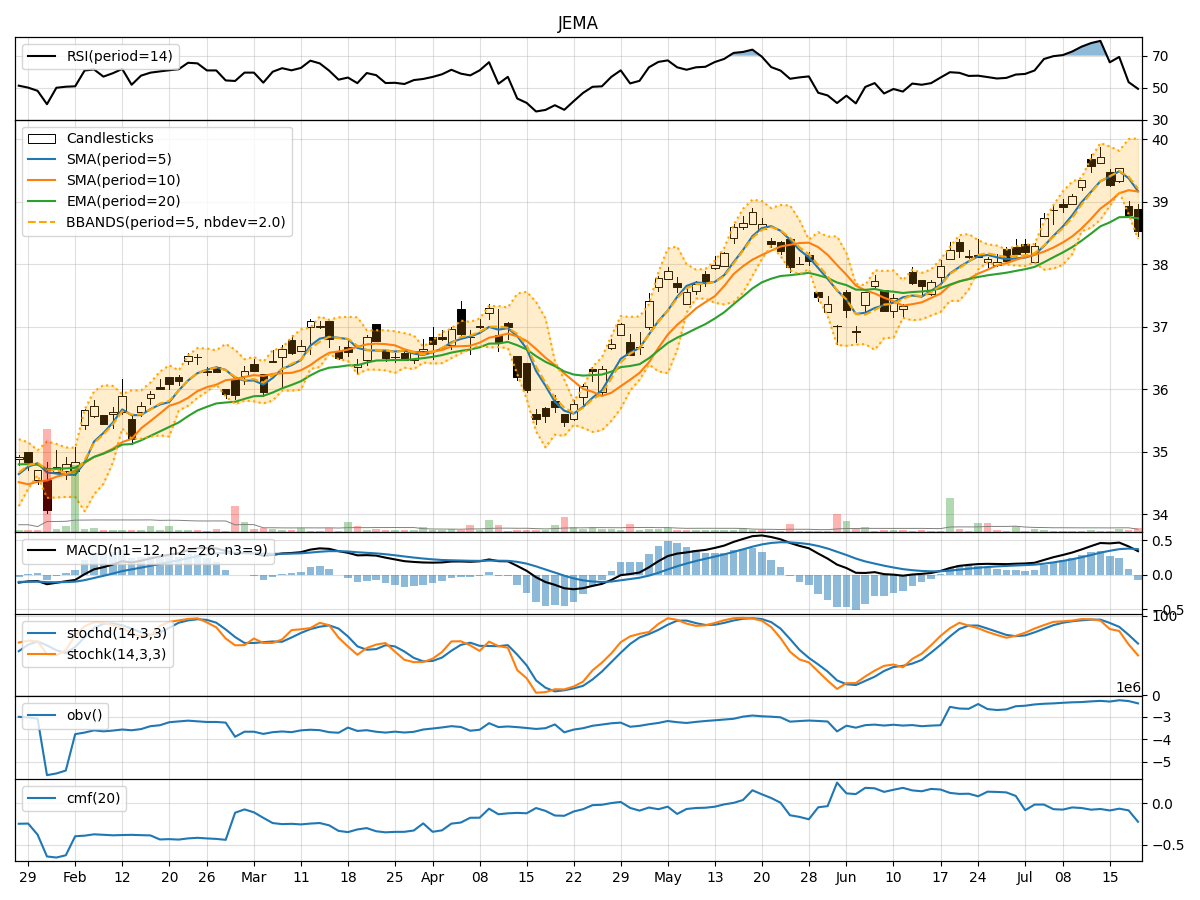
In analyzing the technical indicators for JEMA stock over the last 5 days, we will delve into the trend, momentum, volatility, and volume indicators to provide a comprehensive outlook on the possible stock price movement in the coming days. By examining these key indicators, we aim to offer valuable insights and predictions for potential investors or traders.
Trend Analysis:
- Moving Averages (MA): The 5-day Moving Average (MA) has been consistently above the closing prices, indicating an upward trend in the short term.
- MACD: The MACD line has been positive and increasing, while the MACD Histogram has also been rising, suggesting bullish momentum in the stock.
Momentum Analysis:
- RSI: The Relative Strength Index (RSI) has been fluctuating around the 60-70 range, indicating neutral momentum without being overbought or oversold.
- Stochastic Oscillator: Both %K and %D have been hovering around 80, suggesting the stock is neither overbought nor oversold.
Volatility Analysis:
- Bollinger Bands (BB): The stock price has been trading within the Bollinger Bands, with the bands narrowing, indicating reduced volatility.
Volume Analysis:
- On-Balance Volume (OBV): The OBV has been relatively stable, indicating neutral volume flow.
- Chaikin Money Flow (CMF): The CMF has been negative, suggesting outflow of money from the stock.
Key Observations:
- The stock is currently in an upward trend based on moving averages and MACD.
- Momentum indicators suggest neutral momentum without extreme overbought or oversold conditions.
- Volatility has been reducing, indicating potential consolidation or a period of sideways movement.
- Volume indicators show neutral volume flow with a slight outflow of money.
Conclusion:
Based on the analysis of the technical indicators, the next few days for JEMA stock are likely to see continued upward movement with reduced volatility and neutral momentum. Investors may expect the stock price to consolidate within a certain range before potentially resuming its upward trajectory. It is advisable to monitor the trend closely for any signs of reversal or acceleration in price movement.