Technical Analysis of JHAC 2024-05-10
Overview:
In analyzing the technical indicators for JHAC stock over the last 5 days, we will delve into the trends, momentum, volatility, and volume indicators to provide a comprehensive outlook on the possible future stock price movement. By examining key metrics such as moving averages, MACD, RSI, Bollinger Bands, and OBV, we aim to offer valuable insights and predictions for the upcoming trading days.
Trend Indicators:
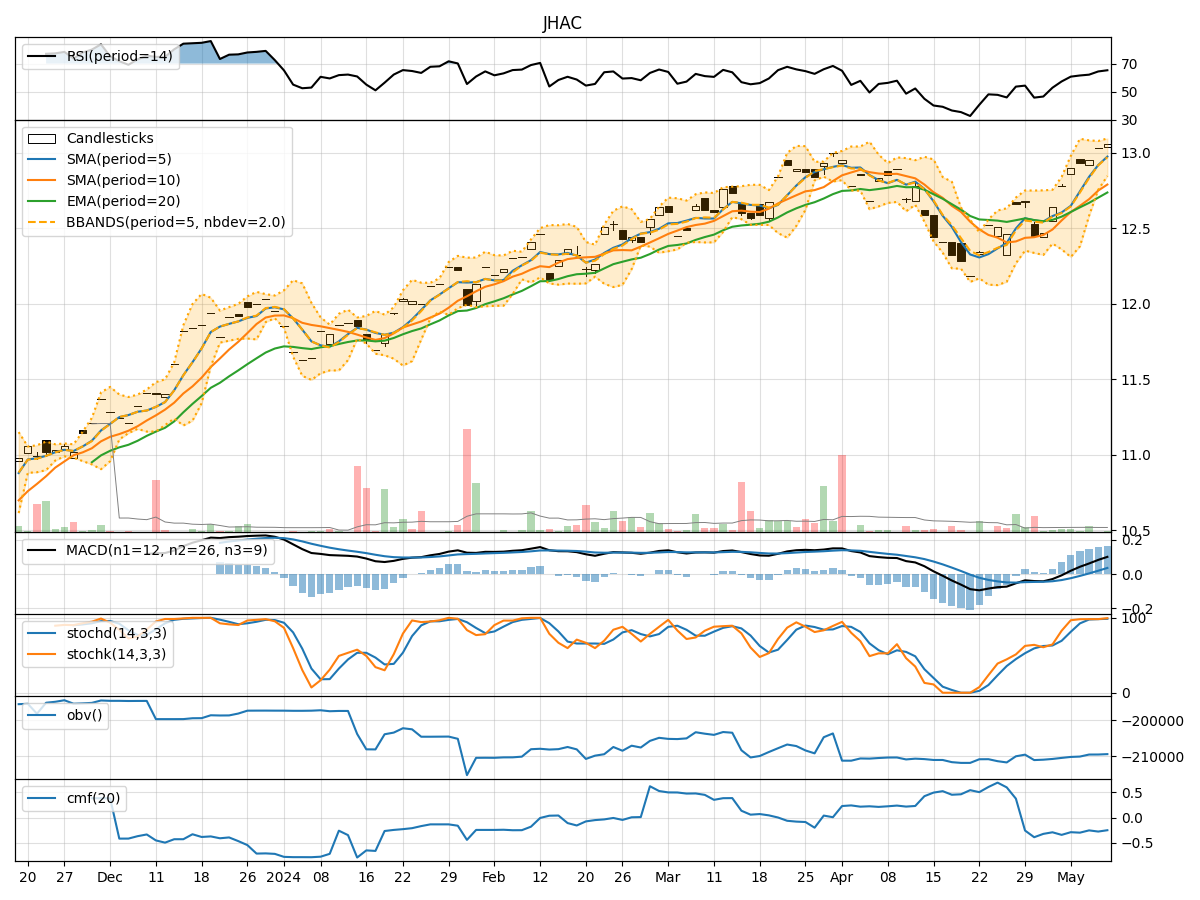
- Moving Averages (MA): The 5-day moving average has been consistently above the 10-day simple moving average, indicating a short-term bullish trend.
- MACD: The MACD line has been trending upwards, with the MACD histogram showing positive values, suggesting increasing bullish momentum.
- EMA: The exponential moving average has been steadily rising, supporting the bullish sentiment in the short to medium term.
Momentum Indicators:
- RSI: The Relative Strength Index has been climbing, reaching levels above 60, indicating increasing buying pressure and potential overbought conditions.
- Stochastic Oscillator: Both %K and %D lines of the Stochastic Oscillator are in the overbought zone, signaling a strong bullish momentum.
- Williams %R: The Williams %R is hovering around 0, suggesting a potential reversal or consolidation phase.
Volatility Indicators:
- Bollinger Bands: The stock price has been trading near the upper Bollinger Band, indicating high volatility and a potential overbought condition.
- Bollinger Band Width: The Bollinger Band Width has been narrowing, suggesting a possible decrease in volatility and a period of consolidation.
- Bollinger Band %B: The %B indicator is above 0.8, indicating that the stock is trading at the upper range of its recent price action.
Volume Indicators:
- On-Balance Volume (OBV): The OBV has been fluctuating but generally trending upwards, indicating accumulation by investors.
- Chaikin Money Flow (CMF): The CMF has been negative, suggesting some selling pressure in the stock despite the price increase.
Conclusion:
Based on the analysis of the technical indicators, the next few days for JHAC stock are likely to see continued bullish momentum in the short term. However, given the overbought signals from indicators like RSI and Stochastic Oscillator, there might be a potential for a pullback or consolidation in the near future. Traders should closely monitor the price action around key support and resistance levels to assess the sustainability of the current uptrend. Exercise caution in entering new positions and consider taking profits if the stock price reaches overextended levels.