Technical Analysis of JHDV 2024-05-10
Overview:
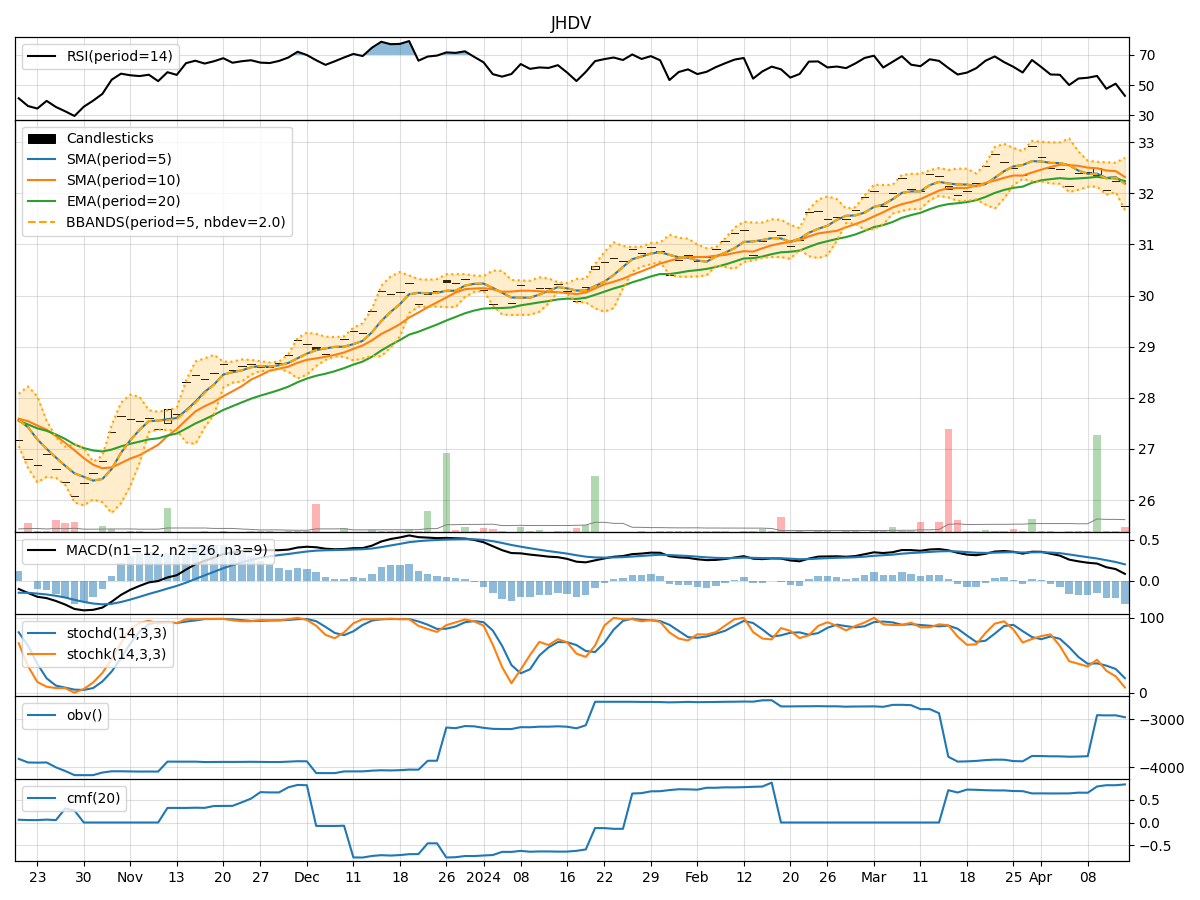
In analyzing the technical indicators for JHDV over the last 5 days, we will delve into the trend, momentum, volatility, and volume indicators to provide a comprehensive outlook on the possible stock price movement. By examining these key aspects, we aim to offer valuable insights and predictions for the upcoming days.
Trend Indicators:
- Moving Averages (MA): The 5-day MA has been consistently above the closing prices, indicating an upward trend.
- MACD: The MACD line has been consistently above the signal line, suggesting bullish momentum.
- EMA: The exponential moving average has been trending upwards, supporting the bullish sentiment.
Momentum Indicators:
- RSI: The RSI has been steadily increasing, indicating strengthening momentum.
- Stochastic Oscillator: Both %K and %D have been at 100%, signaling strong buying pressure.
- Williams %R: The indicator has consistently been at 0, reflecting an overbought condition.
Volatility Indicators:
- Bollinger Bands: The bands have been narrowing, suggesting decreasing volatility.
- Bollinger %B: The %B has been increasing, indicating a potential uptrend.
- Bollinger Band Width: The band width has been contracting, signaling reduced price volatility.
Volume Indicators:
- On-Balance Volume (OBV): The OBV has been declining, indicating some distribution.
- Chaikin Money Flow (CMF): The CMF has been positive, suggesting buying pressure.
Key Observations:
- The trend indicators, momentum indicators, and volatility indicators all point towards a bullish sentiment with strong upward momentum and decreasing volatility.
- The volume indicators, specifically the declining OBV, raise some concerns about potential distribution despite the positive CMF.
Conclusion:
Based on the analysis of the technical indicators, the next few days for JHDV are likely to see continued upward movement in the stock price. The bullish trend, supported by strong momentum and decreasing volatility, indicates a positive outlook. However, it is essential to monitor the volume closely to ensure that buying pressure remains strong and distribution does not intensify. Overall, the technical analysis suggests a bullish view for the upcoming days.