Technical Analysis of JHEM 2024-05-10
Overview:
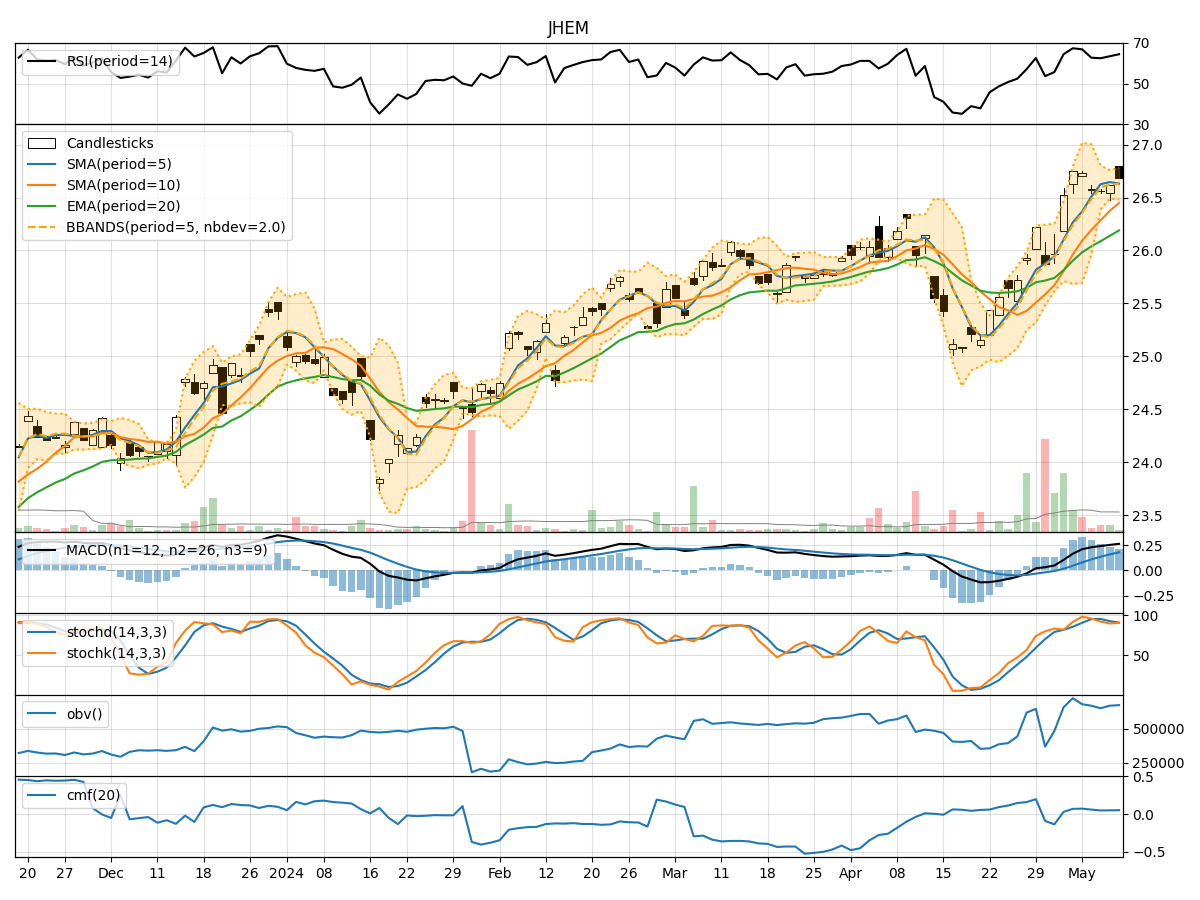
In the last 5 trading days, JHEM stock has shown a relatively stable performance with minor fluctuations in price and volume. The technical indicators across trend, momentum, volatility, and volume categories provide insights into the stock's potential future movements. Let's delve deeper into each category to form a comprehensive analysis and make informed predictions.
Trend Analysis:
- Moving Averages (MA): The 5-day Moving Average (MA) has been consistently above the Simple Moving Average (SMA) and Exponential Moving Average (EMA), indicating a bullish trend.
- MACD: The MACD line has been consistently positive, with the MACD Histogram (MACDH) also showing an increasing trend, suggesting bullish momentum.
Momentum Analysis:
- RSI: The Relative Strength Index (RSI) has been above 50, indicating bullish momentum in the stock.
- Stochastic Oscillator: Both %K and %D lines of the Stochastic Oscillator have been above 80, signaling overbought conditions but also strong upward momentum.
Volatility Analysis:
- Bollinger Bands (BB): The Bollinger Bands have been relatively narrow, indicating low volatility in the stock price.
- Bollinger %B (BBP): The %B has been fluctuating around 0.5, suggesting the stock is trading around the middle of the Bollinger Bands.
Volume Analysis:
- On-Balance Volume (OBV): The OBV has shown a slight increase over the last 5 days, indicating accumulation of the stock.
- Chaikin Money Flow (CMF): The CMF has been positive but relatively flat, suggesting steady buying pressure.
Key Observations and Opinions:
- Trend: The stock is in an upward trend based on moving averages and MACD.
- Momentum: Momentum indicators like RSI and Stochastic Oscillator suggest bullish momentum but also indicate potential overbought conditions.
- Volatility: Low volatility as indicated by narrow Bollinger Bands suggests consolidation in the stock price.
- Volume: The slight increase in OBV and positive CMF indicate moderate buying pressure.
Conclusion:
Based on the analysis of technical indicators, the next few days for JHEM stock are likely to see continued upward movement with moderate volatility and steady buying pressure. Traders should be cautious of potential overbought conditions indicated by momentum indicators and monitor for any signs of reversal. Overall, the outlook for JHEM stock remains bullish in the short term.