Technical Analysis of JHID 2024-05-10
Overview:
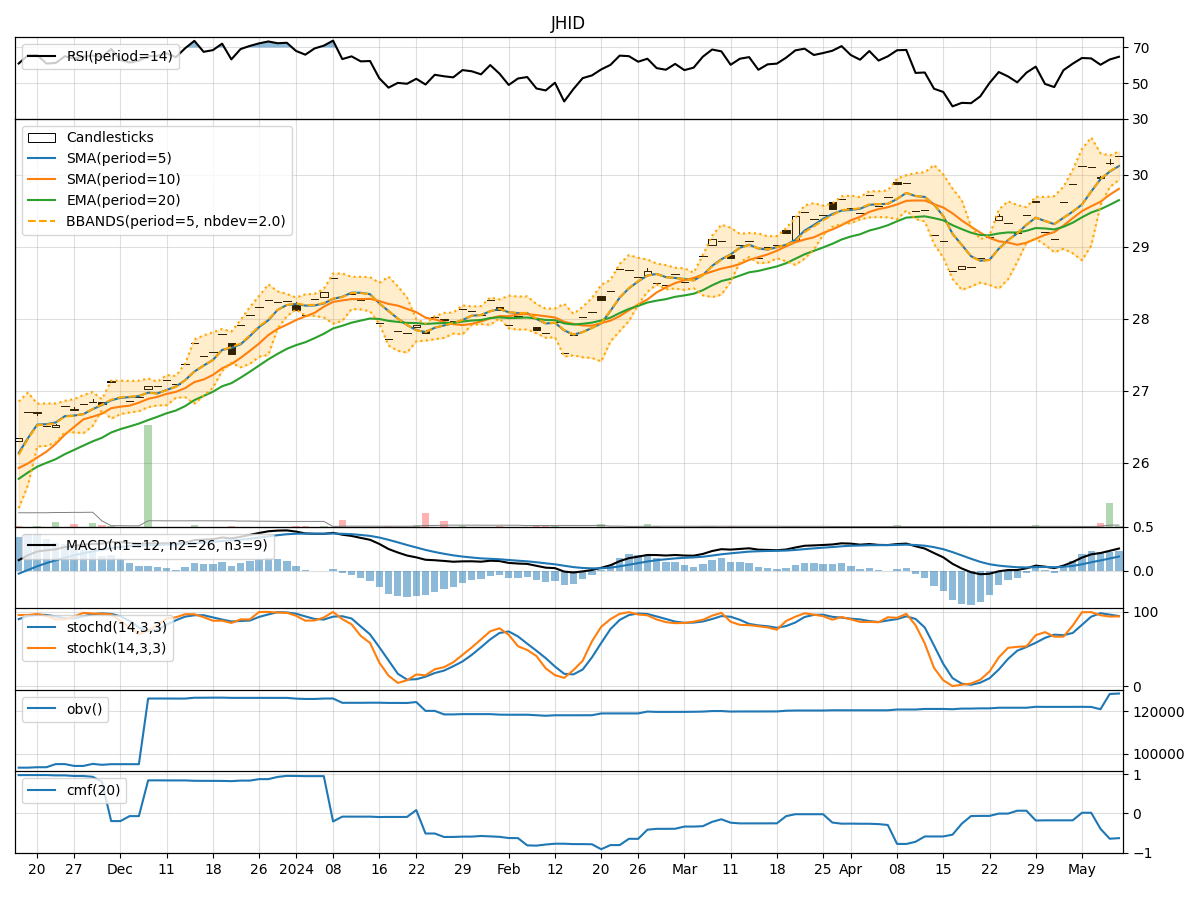
In analyzing the technical indicators for JHID stock over the last 5 days, we will delve into the trend, momentum, volatility, and volume indicators to provide a comprehensive outlook on the possible stock price movement in the coming days. By examining these key indicators, we aim to offer valuable insights and predictions to guide investment decisions.
Trend Analysis:
- Moving Averages (MA): The 5-day MA has been consistently above the closing prices, indicating a short-term uptrend.
- MACD: The MACD line has been trending upwards, crossing above the signal line, suggesting bullish momentum.
- RSI: The RSI has been fluctuating around the overbought territory, indicating strong buying pressure.
Key Observation: The trend indicators point towards a bullish sentiment in the short term.
Momentum Analysis:
- Stochastic Oscillator: Both %K and %D have been hovering in the overbought zone, signaling potential overvaluation.
- Williams %R: The indicator has been fluctuating around the oversold territory, suggesting a possible reversal.
Key Observation: Momentum indicators show a mixed signal, with stochastic indicating overbought conditions and Williams %R hinting at a potential reversal.
Volatility Analysis:
- Bollinger Bands (BB): The stock price has been trading within the bands, with the bands narrowing, indicating decreasing volatility.
- BB %B: The %B indicator has been hovering around 0.5, suggesting a balanced market sentiment.
Key Observation: Volatility indicators signal a consolidation phase with decreasing volatility.
Volume Analysis:
- On-Balance Volume (OBV): The OBV has been fluctuating, indicating indecision among investors.
- Chaikin Money Flow (CMF): The CMF has been negative, suggesting selling pressure in the market.
Key Observation: Volume indicators reflect a bearish sentiment with selling pressure prevailing.
Conclusion:
Based on the analysis of trend, momentum, volatility, and volume indicators, the next few days' possible stock price movement for JHID is likely to be sideways to slightly bearish. While the trend indicators suggest a bullish sentiment in the short term, momentum indicators show a mixed signal with potential overbought conditions. Volatility indicators point towards a consolidation phase, while volume indicators indicate selling pressure in the market.
Key Conclusion: The overall outlook leans towards a sideways to slightly bearish movement in the coming days. Investors should closely monitor key support and resistance levels for potential entry or exit points in their trading strategy.