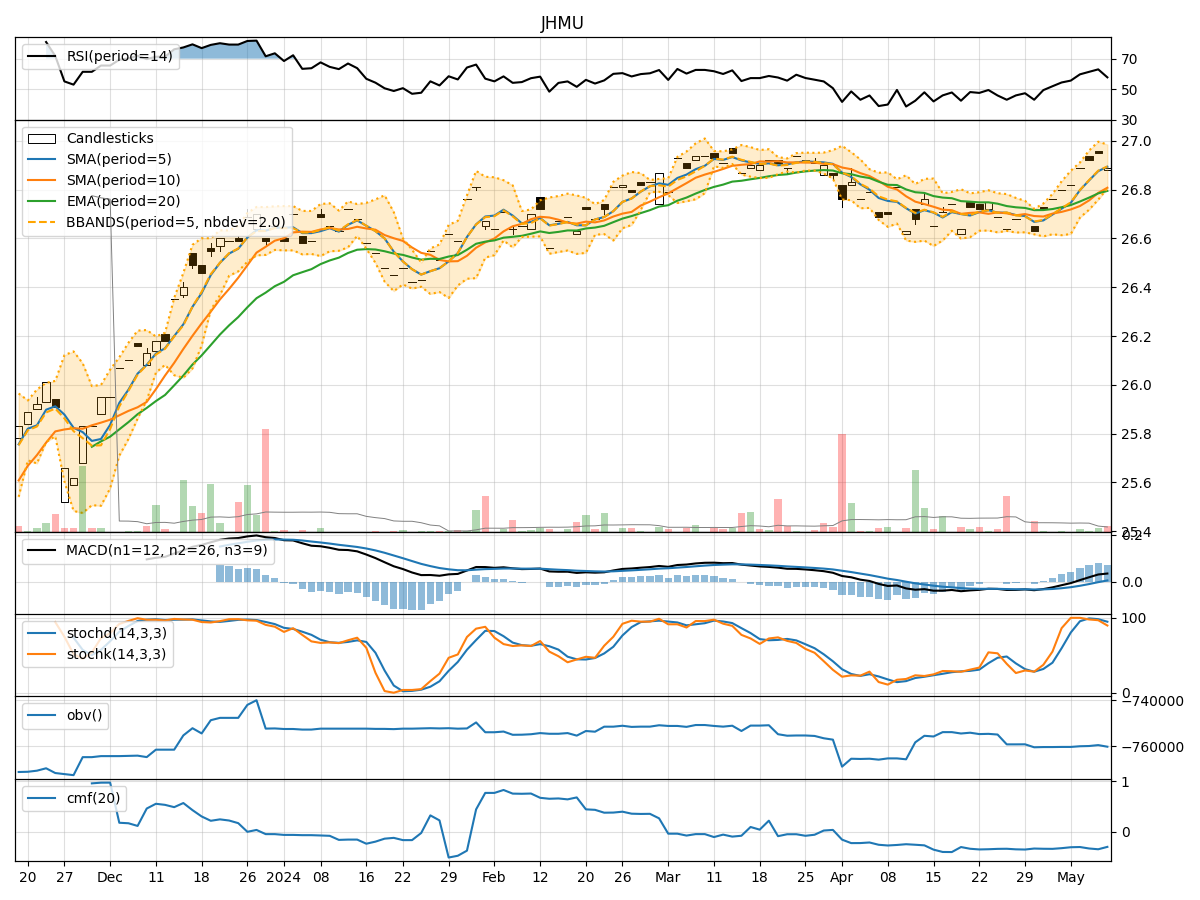
Technical Analysis of JHMU 2024-05-10
Overview:
In analyzing the technical indicators for JHMU stock over the last 5 days, we will delve into the trend, momentum, volatility, and volume indicators to provide a comprehensive outlook on the possible stock price movement in the coming days. By examining these key indicators, we aim to offer valuable insights and predictions to guide investment decisions.
Trend Indicators:
- Moving Averages (MA): The 5-day Moving Average (MA) has been steadily increasing, indicating a positive trend in the stock price.
- MACD: The Moving Average Convergence Divergence (MACD) has been consistently rising, suggesting bullish momentum in the stock.
- EMA: The Exponential Moving Average (EMA) has also been on an upward trajectory, supporting the bullish trend.
Momentum Indicators:
- RSI: The Relative Strength Index (RSI) has been trending upwards, indicating increasing buying pressure and potential further upside.
- Stochastic Oscillator: Both %K and %D of the Stochastic Oscillator have been relatively high, signaling strong bullish momentum.
- Williams %R: The Williams %R is in the oversold territory, suggesting a potential reversal to the upside.
Volatility Indicators:
- Bollinger Bands: The Bollinger Bands have been narrowing, indicating decreasing volatility and a possible period of consolidation.
- Bollinger %B: The %B indicator is below 1, suggesting the stock is trading below the lower Bollinger Band, potentially indicating an oversold condition.
Volume Indicators:
- On-Balance Volume (OBV): The OBV has been fluctuating, indicating mixed buying and selling pressure in the stock.
- Chaikin Money Flow (CMF): The CMF has been negative, suggesting outflow of money from the stock.
Key Observations and Opinions:
- Trend: The stock is in an upward trend supported by the moving averages and MACD.
- Momentum: Momentum indicators like RSI and Stochastic Oscillator suggest bullish momentum in the stock.
- Volatility: Bollinger Bands narrowing indicate a potential period of consolidation or a calm before a potential move.
- Volume: Mixed signals from OBV and negative CMF indicate uncertainty in the stock's buying and selling pressure.
Conclusion:
Based on the analysis of the technical indicators, the next few days for JHMU stock are likely to see further upside movement. The bullish trend supported by moving averages and MACD, along with positive momentum indicators, suggests a potential continuation of the upward trajectory. However, the narrowing Bollinger Bands and mixed volume signals indicate a possible period of consolidation before a potential breakout. Investors should closely monitor the stock for any signs of reversal or continuation of the current trend.